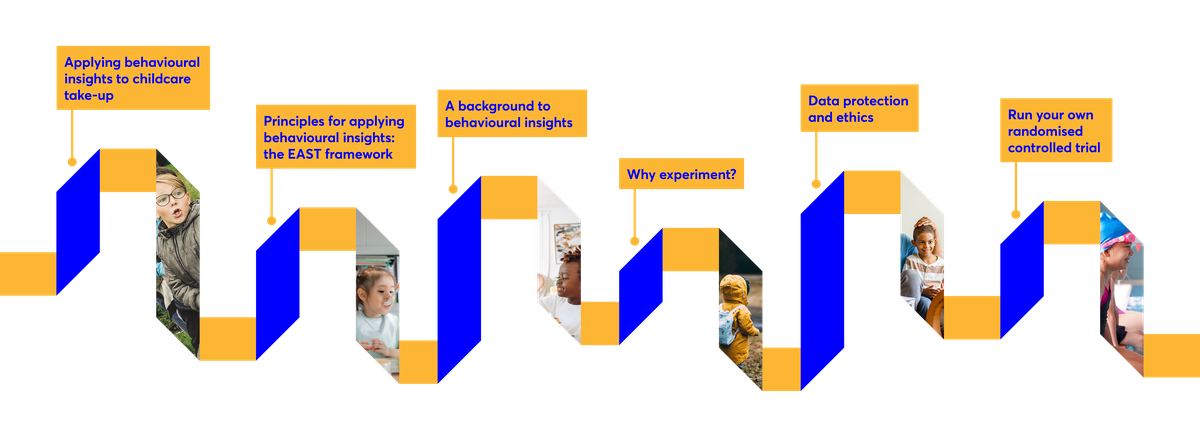
This toolkit is designed for early years teams in local authorities across the UK. It lays out step-by-step how local authorities can use behavioural insights to boost the number of parents accessing childcare.
This toolkit has two aims: first, to offer ideas for increasing the number of parents taking up their entitlement for free childcare schemes. Second, to be a one-stop-shop with all the information that local authorities need to run their own randomised controlled trials (RCTs). In the past, we have heard that many local authorities find the prospect of running RCTs daunting, but with the resources in this toolkit they don’t have to be.
What is the problem we are trying to solve? We think that too few children get the opportunity to access the childcare available to them. Government support available to help parents with childcare costs has increased over the past decade, with the introduction of the 15 hour free childcare offer for disadvantaged 2 year olds in England in 2013, the Early Learning and Childcare expansion to 1,140 hours for all three and four year olds and eligible two year olds in Scotland in 2021 and through the Flying Start Scheme in Wales. But many parents are still missing out. Take-up of the 2 year-old offer has never been particularly high, peaking at 72% in 2018 in England, and disadvantaged children remain the group who are least likely to use childcare.

This toolkit includes:
Covariates: Other factors (eg, age or gender) which are associated with your outcome measure. Called covariates because they vary with the outcome measure. You can adjust for covariates in your regression (although we do not explain how in this guide) – for example, looking at the impact of a new letter controlling for differences in age and gender between the control and intervention groups.
Data cleaning and merging: Preparing your data in a format that can be used for analysis. This includes deleting duplicates, ensuring outcome data is stored in units of 0 and 1, and merging outcome data with data on which group participants are in.
Effect size: A number measuring the strength of the relationship between two variables. In randomised controlled trials, it refers to the effect of your policy or intervention compared to the control group.
Intervention: A term for a policy change or communication (eg, sending a new version of the two-year-old letter). People who receive the policy or intervention are in the intervention group.
Intervention assignment (or intervention status): Whether a person is in the intervention group or the control group.
Intervention effect: The quantitative impact of the policy change or intervention (eg, a new version of the two-year-old offer letter increasing applications by five percentage points).
Null and alternative hypothesis: Hypotheses you generate as part of the process to test for statistical significance. The null hypothesis is always that there is no effect, eg, no difference between the two two-year-old offer letters. The alternative hypothesis is always that there is an effect, e.g. a difference between the two two-year-old offer letters.
Outcome measure: A specific, quantifiable measure used to assess whether your policy or intervention has been effective. The most common outcome measures in this field are applications for childcare and take-up of childcare.
P value: A number between 0 and 1 that represents the probability that the null hypothesis is true, given the data observed in the analysis. The conventional threshold for statistical significance is P values under 0.05 (5% probability).
Randomised controlled trials: A type of evaluation that is considered the most robust way to understand whether a programme, policy or intervention is effective. Participants in the trial are randomly divided into two or more groups – at least one receives the intervention and one is a control group. At the end, we can compare outcomes to precisely estimate the impact of the programme. Because the groups are randomly assigned, we can assume any differences between them at the end are because of the programme, and not another factor.
Sample size: The number of participants taking part in your study. A sample is drawn from a wider population, for example, of all the parents eligible for the two-year-old offer.
Statistical power: The probability that your study will be able to detect a statistically significant effect if the alternative hypothesis (see Null and alternative hypothesis) is true. We use statistical power calculations to work out how many participants you need in your study to detect an effect of a certain size.
Statistical significance: A result is statistically significant if it’s very unlikely to have occurred just by chance (a slight simplification: the technical definition is that it’s very unlikely to have occurred if the null hypothesis were true). The conventional threshold for statistical significance is a P value under 0.05.
Regression: A statistical process which gives us information about the strength of the relationship between two variables (e.g. homework time and exam results). We use regression as the main analysis tool for RCTs to understand whether our intervention is effective.
Regression coefficient: A value that quantifies the relationship between two variables, such as homework time and exam results. Specifically, it tells you how one extra unit of a variable (eg, one extra hour of homework) is associated with a change in the other variable (exam results). With RCTs, it can tell you how a difference in intervention assignment (whether one is in the control or intervention group) affects the outcome measure (eg, application rate); or more simply, the difference in application rates between the control and intervention groups.
95% confidence intervals: A range of values which show the uncertainty around regression coefficients (eg, uncertainty about the size of an intervention effect).
Video tutorials
Sample letters