About Nesta
We are Nesta, the UK's innovation agency for social good. We design, test and scale solutions to society's biggest problems. Our three missions are to give every child a fair start, help people live healthy lives, and create a sustainable future where the economy works for both people and the planet.
For over 20 years, we have worked to support, encourage and inspire innovation. We work in three roles: as an innovation partner working with frontline organisations to design and test new solutions, as a venture builder supporting new and early-stage businesses, and as a system shaper creating the conditions for innovation.
Harnessing the rigour of science and the creativity of design, we work relentlessly to change millions of lives for the better. Find out more at nesta.org.uk.
About Nesta's Centre for Collective Intelligence Design
Nesta's Centre for Collective Intelligence Design helps create new ways for communities to use technology to harness their insights, ideas and power to act on the problems that matter to them and create the futures they want. We design tools and projects that allow communities to respond collectively to challenges, and that help public and voluntary sector institutions strengthen trust and collaboration with citizens.
We use rigorous research methods to test, learn and evaluate each solution. Our flagship Collective Intelligence Design Playbook helped to define the field and is used by practitioners around the world. We have worked with organisations from the UN to the BBC.
To learn more, visit nesta.org.uk/project/centrecollective-intelligence-design or email the team at [email protected].
About The Strategy Room
The Strategy Room is a collaboration between Nesta's Centre for Collective Intelligence Design, digital studio Fast Familiar and University College London's (UCL) Climate Action Unit. It was designed with input from colleagues based at Lambeth, Sandwell and Southend-on-Sea councils.
Authors
Aleks Berditchevskaia, Chris Edgar, Kathy Peach (Nesta). Dan Barnard, Rachel Briscoe (Fast Familiar)
Recommended citation: Berditchevskaia, A., Edgar, C., Peach, K. (2023). The Strategy Room: an innovative approach for involving communities in shaping local net zero pathways. London: Nesta.
All photos featured in the report were obtained with participants' informed consent.
If you'd like this publication in an alternative format, such as Braille, large-print or audio, please contact us at: [email protected].
Published July 2023
ISBN: 978-1-916699-02-1
Design: Green Doe Graphic Design Ltd
Nesta is a registered charity in England and Wales with company number 7706036 and charity number 1144091. Registered as a charity in Scotland number SCO2833. Registered office: 58 Victoria Embankment, London, EC4Y ODS
Key findings
Between January and March 2023, we piloted a novel digital engagement tool, The Strategy Room, to help local authorities understand their residents' priorities for net zero policy across the topics of heat, travel and food. Twelve local authorities ran 66 sessions between them, attracting almost 640 participants to make policy recommendations for their local areas.
Key results
1 There is strong support for most net zero policies, and those with clearly framed community benefits are more popular than more individualistic policies.
2 Local context seems to make a difference to policy preferences. 'Community energy schemes' and 'Sustainably-sourced food for public services' were popular everywhere. Travel policies showed the most variation in preferences both within and between different locations.
3 Health and community cohesion co-benefits are the strongest predictors of whether people recommended net zero policies. But for some policies, co-benefits that reflect real-time public concerns like energy security are most important.
4 Participants in The Strategy Room were significantly more positive about net zero policies than the respondents in an online YouGov poll. They also reported feeling more able to reduce climate change and more connected to their local area.
5 Even short discussions of 5 to 10 minutes can lead to small but significant changes in opinion. Deliberation led to an overall increase in support for three of the eight policies tested and good deliberation increased people's satisfaction with the group's final policy recommendations.
6 Creative digital tools for public engagement on net zero make climate policy more accessible to diverse audiences, helping councils reach beyond 'the usual suspects'.
7 The results show the public has an appetite for bold net zero policies and people have clear preferences for which policies would work best in the places they live. This pilot also demonstrates that, compared to traditional methods like opinion surveys, innovative public engagement methods may increase buy-in for net zero policies and build people's sense of being able to impact climate change – both important prerequisites for behavioural change.
Introduction
The United Kingdom (UK) has set ambitious targets to reach net zero emissions by 2050. But to date, both policy commitments and societal change around lifestyles and consumption have lagged behind.
Local authorities are on the frontline of this transition. They have the potential to directly influence up to 30% of carbon emissions in their area, and this increases to 80% when considering indirect influence.
This is a massive but, as yet, untapped opportunity. Even as three-quarters of local authorities have recognised the risk posed by climate change and declared a climate emergency, by 2022 one in five councils still hadn't developed a clear climate action plan to achieve net zero.
Public engagement and consent will be crucial to securing the UK's pathway to net zero. Both the UK Climate Change Commission and the UK Government's independent review of net zero have emphasised an urgent need for the public, as citizens and consumers, to have a much larger role. In the 2021 Net Zero Strategy, the UK Government set out an ambition to "give people opportunities to participate in and shape our plans for reaching net zero, thereby improving policy design, buy-in and uptake of policies."
Evidence suggests that the UK public is ready. Concern about climate change remains consistently high and annual surveys show that people are willing to make the shift to low-carbon lifestyles, but they need regulators and businesses to lead the way.
And yet traditional approaches to public engagement are failing to unblock stuck decision-making. Both local and national governments draw on a limited playbook of tools, from public consultation surveys and focus groups to the relatively newer citizens' assemblies – that can struggle to scale or reach beyond 'the usual suspects'.
There is a desperate need for new approaches that win the hearts and minds of the public at large while also giving meaningful input into decision-making. Nesta has long argued for novel engagement tools that foster active participation, two-way communication, and facilitate a sense of ownership and agency among citizens. These tools need to be scalable and easily delivered by potentially under-resourced organisations; their components must be reproducible, cost-effective, and not rely on specialised expertise or infrastructure.
In this report, we introduce an innovative approach that responds to this need. The Strategy Room is an immersive experience that helps local authorities engage their residents in designing net zero policy that responds to local, social and environmental contexts. We describe how we developed the approach and provide the first wave of results from a three-month pilot where more than 600 members of the UK public told us their preferences for how to get to net zero. With data available at both the local and national levels, we hope these findings will prove useful to decision-makers in local and central government.
What is The Strategy Room?
The Strategy Room experience
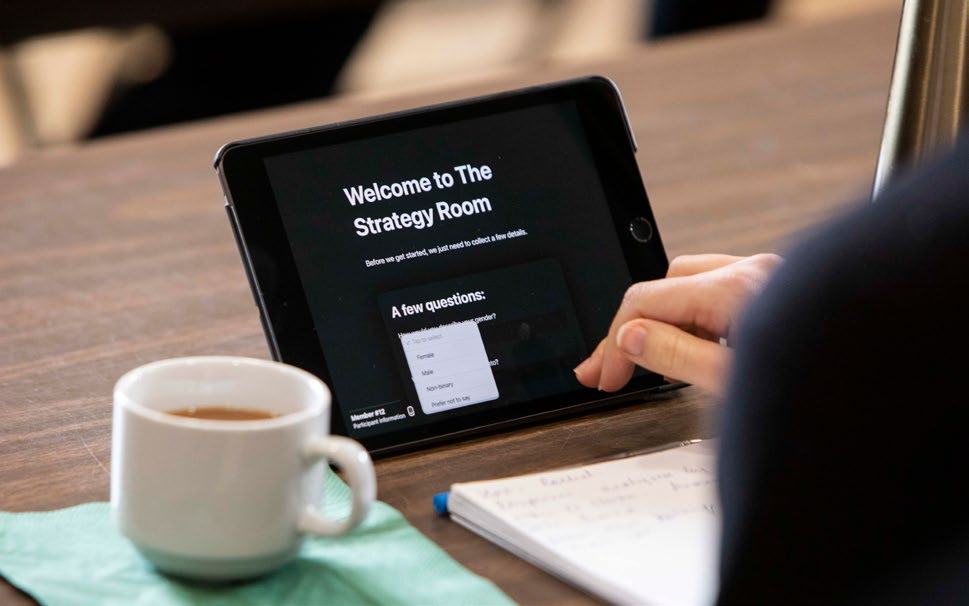
Twelve participants sit around a table, each with an iPad. Working through a structured format, they review video content, discuss and express opinions about measures within three net zero policy areas: travel, heat and food.
Carefully crafted 'testimonies from the future' (performed by filmed actors) draw participants into the scenario, while a facilitator supports the group to share their opinions and collaborate to find solutions that will work best for where they live.
The innovative digital platform collects anonymised data about participants' preferred strategies. It also captures how views shift during group discussions.
The Strategy Room is designed to leverage the collective intelligence of small groups to evaluate net zero policy through deliberative discussion and interactive polling. It can be played in a modular way combining two of the modules, or playing them individually. This allows local authorities to adapt the experience depending on policy priorities or practical constraints. During the pilot, we tested four options for delivery: Travel (only), Heat (only), Travel and Food, and Heat and Food. We rotated these delivery modes to ensure roughly equivalent participation across all three modules. Figure 1 gives an overview of the process experienced by participants within each module.
Figure 1: The Strategy Room game plan
This four-step process diagram illustrates "The Strategy Room game plan". Example screens are shown displaying data visualizations for travel module content.
01 Intro animation
Equips participants with knowledge, doesn't require them to read.
Screens from the introduction animation for the Travel module
02 Character testimony
'Postcards from the future': a character talks about how a policy affected them.
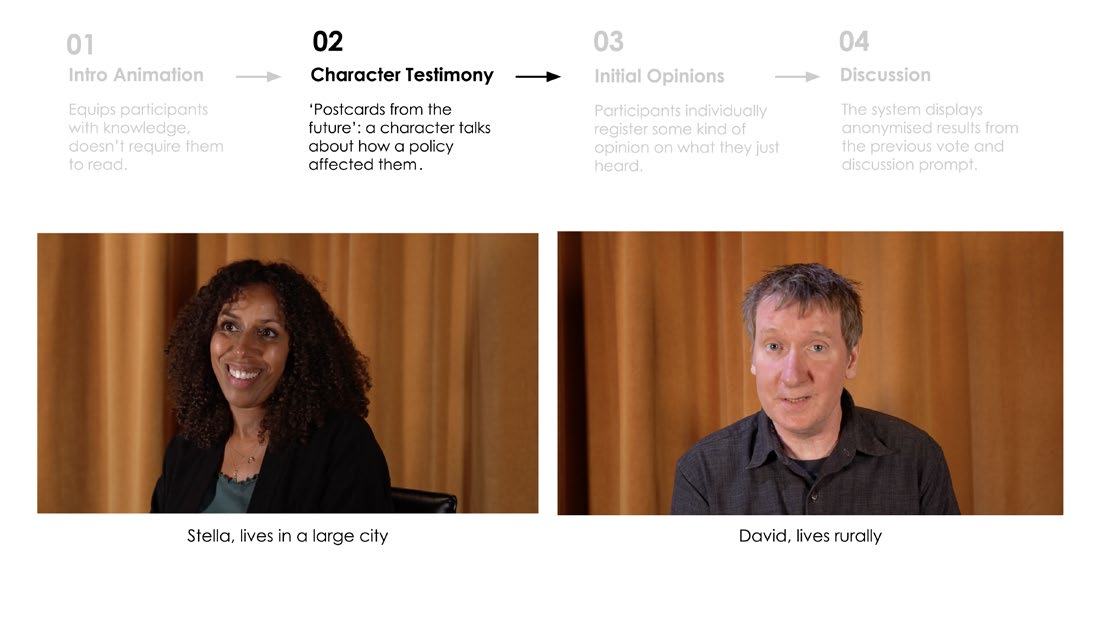
Stella lives in a large city
David lives rurally
03 Initial options
Participants individually record their initial opinion on the policy.
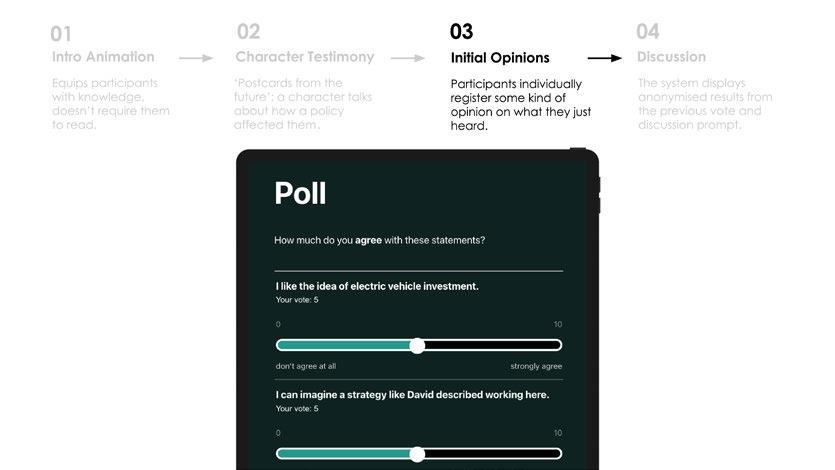
04 Discussion and final rating of support for each policy
Group discussion of initial opinions, followed by individual final policy recommendation.

Each module (Travel, Heat, Food) follows the same basic structure
The Strategy Room was designed to be engaging and enjoyable for participants; an alternative to the typical methods used to involve the public in climate policy. It combines elements of digital storytelling, serious games, and deliberative methods like climate assemblies and deliberative polls®.
The approach has several key benefits that set it apart from the two most common approaches to public input on net zero policy: online polling and climate assemblies.
Unlike online polling, The Strategy Room involves group deliberation, providing an opportunity for participants to listen and learn about the issue through the video content and from hearing other diverse perspectives before making a decision. This extra time and the engaging content enable a more nuanced and informed exploration of complex issues, overcoming many of the limitations of public polls.
In comparison to citizen assemblies, The Strategy Room experience places lower demands on participants' and facilitators' time. It can be played in less than two hours, and does not foreground scientific or subject experts – which makes it more accessible, relatable and inclusive to a wider range of people. It is also highly portable and scalable, which allows many more people to participate and at lower cost.
Finally, the data captured through The Strategy Room is openly available on a public platform (www.strategyroom.uk) and, unlike most public engagement exercises carried out by local authorities, is comparable between areas, updated in real-time and aggregated to give a national picture. Anyone can explore the results at both local and national levels. The platform was designed together with local authorities to make sure the data is useful and usable by them.
The Strategy Room attempts to balance flexibility, depth, cost and feasibility to support local councils to generate useful data and engage a wider range of residents in discussions on net zero policy.

Methodology
Figure 2: the design and development process
This diagram illustrates the design and development process of The Strategy Room over several months.
- June 2022: Project launched. Nesta selects Fast Familiar and UCL's Climate Action Unit as project partners, and three local authorities as co-design partners.
- July 2022: Prototype testing with people and councils. Lo-fi versions of The Strategy Room tested in three local authorities and improved. Digital build commences.
- September 2022: The Strategy Room development begins. Consultation with net zero experts, environmental psychologists and behavioural scientists. Co-design sessions with local authority officers in three councils.
- January 2023: The Strategy Room pilot launches. Between January and March, 638 people in 12 local authorities take part in 66 sessions. Work on data visualisation platform starts in March.
The Strategy Room was developed over six months (Figure 2) and tested during a three-month pilot. The design was inspired by findings from social neuroscience that emphasise the importance of collective identity for motivating pro-environmental behaviours. All of the game's policy content was developed in close consultation with net zero experts. We also received advice from an expert in social neuroscience to help us incorporate the latest findings on the psychology of climate change into the narrative framing.
Three local authorities in different parts of England – Lambeth, Sandwell and Southend-on-Sea – acted as co-design partners throughout the development process. This ensured that the content explored in the game was relevant across a range of circumstances and helped us to tailor data collection to existing knowledge gaps. Before creating the digital version of the experience, we carried out a round of user testing with local residents in Lambeth, Sandwell and Southend-on-Sea. This helped us refine the final design and plan the delivery process.
Net zero policies explored through The Strategy Room
Figure 3: example user interface from The Strategy Room
This screenshot shows the screen where participants are asked to provide their final recommendations for policies that should be implemented in their area.
We designed The Strategy Room to give people a say on the policies that could be applied in their local area on the path to net zero. Covering the key topics of Travel, Heat and Food, we asked participants to explore eight core net zero strategies (Table 1). For each of these, they provided a rating out of 10 for how much they recommend it being implemented in their area. Participants rate policies twice: immediately prior to and after the final group discussion within a given module (Figure 3). The results in the report are based on the post-discussion ratings. We refer to these throughout as 'policy ratings' or 'policy recommendations'.
The eight net zero strategies were selected based on two criteria:
- potential for significant impact in the journey to net zero according to the latest carbon emissions modelling[^7].
- less existing evidence about the level of public support.
As much as possible, we focused on policies that could lie within the remit of local authorities. Although in reality, many of the policies also require some support from central government.
Table 1: the eight core net zero policies explored in The Strategy Room
| Travel |
Heat |
Food |
| More electric car (EV) infrastructure and vehicles |
Energy-included rents |
Environmental rating for supermarkets |
| The local council would increase the number of charge points for electric cars on streets and in town centres. The local council would also switch to using EVs. |
This policy would require landlords to include energy bills in the monthly rents that people pay. Landlords would have to pay for any extra energy used that is not already covered by the rent, but would be able to access some financial help to insulate their properties/make their properties more energy efficient. |
Supermarket chains would receive one overall rating to inform shoppers how environmentally friendly each supermarket is. This rating would be based on the products they stock, their approach to packaging, how much they waste etc. It would be revised regularly and would be made publicly available to consumers. |
| Town centre redevelopment |
Improving the energy efficiency of social housing |
Local and sustainably-sourced food in public services |
| The local council would pedestrianise and make changes to town centres by adding cycle and bus lanes, installing plants and trees to improve how the space looks and provide shade, and charging petrol or diesel cars to drive into them. |
The local council would renovate social housing in the area by installing insulation and large heat pumps which serve groups of properties. The scheme would be paid for using special loans that would be repaid with income from the social housing rent. |
Compulsory standards would be introduced for the sourcing of food in hospitals, schools and prisons. This would expand the criteria currently used by institutions when sourcing food to include quality of produce, seasonality and environmental standards. |
| Subscription-based service for all local transport |
Community renewable energy schemes |
|
| The local council would set up a subscription-based service for local transport. A single app would offer access to electric buses, trains, bicycles, and services like electric taxis, cargo bikes, e-scooters, e-mopeds and e-cars. Residents would pay a fixed monthly amount to use all these services, or 'pay as you go'. |
Local residents would have the option to invest in schemes to generate renewable energy locally – such as through solar panels on local NHS Trust buildings and in solar farms. This system would produce energy to power homes locally, and send energy where it is needed. Residents could receive interest on their investments over time. |
|
Previous research on public preferences for net zero options suggests that the public cares deeply about policies being fair and accessible. The Strategy Room allows for many of these concerns to surface organically during group deliberation. To try to capture some of these considerations more systematically, we also asked participants to discuss and rate two fairness adjustments, both related to reducing the costs of the electric vehicle (EV) infrastructure policy (Table 2). For the purpose of this report, we present the findings related to fairness adjustments alongside the eight core policies.
Table 2: the two fairness-adjusted electric vehicle (EV) policies
| Policies |
| Subsidised EV car clubs |
| The local council would provide financial support so that people can use EVs at a discounted price through 'e-car clubs'. The cars would be available for rent and come with charging facilities. |
| Trade-in scheme for petrol and diesel cars |
| The local council would offer financial incentives, up to £2,000, to people who trade in their petrol or diesel cars. People could choose to either put this money towards buying an EV, or as travel allowance for use on local public transport. |
At the end of each session, The Strategy Room explicitly asks participants to rate the importance of four general co-benefits (Table 3) in relation to their final net zero policy recommendations. Climate policies that are associated with wider societal benefits are more popular with the public.
Table 3: the four general co-benefits of net zero policies explored in The Strategy Room
| Co-benefits |
| Jobs: The strategies we are recommending will result in new goods, jobs or services produced in the area. |
| Health: The strategies we are recommending will mean people are healthier. |
| Poverty: The strategies we are recommending will mean there is less poverty – for example fuel poverty, or people needing to use food banks. |
| Community: The strategies we are recommending will mean people feel a stronger sense of community. |
Within each of the three modules, participants provide further contextual information about their preferences and socio-demographic background through interactive polls. Each module is intentionally different to maintain participant engagement.
After each session of The Strategy Room, participants are also asked to complete a short survey that measures their:
- overall satisfaction with the policies recommended by the group
- overall enjoyment of the game
- perceived quality of deliberation
- perceived efficacy in relation to addressing climate change
- identification with their local area and community.
Each session is delivered by a two-person team; a technician who oversees the equipment and a facilitator who guides the participants through the experience. The facilitator helps to ensure that deliberation runs smoothly and answers any clarifying questions about the policies.
During the pilot study, almost half of the sessions were attended by project staff who made observational notes on key themes that surfaced during the participants' discussions. We include quotes from these sessions throughout this report.
Comparison with YouGov
For comparison, we ran an online survey with 2,009 UK residents through YouGov's Omnibus platform. Similar to The Strategy Room, we asked participants to rate eight core policies and two fairness-adjusted policies across the topics of Travel, Heat and Food using condensed versions of the policies adapted from The Strategy Room narrative. We also captured data about their perceived efficacy with respect to climate change and their level of identification with their local area.
Research questions
Beyond helping councils to capture the net zero policy preferences of their local residents, we set out to understand which factors influence participants' ratings of different policies. We looked at the impact of deliberation, the importance of different co-benefits, the influence of social identity and perceived group efficacy on the policy ratings. Specifically, we set out to learn:
1 What net zero policies are most popular amongst the public?
2 How did the policy ratings of The Strategy Room participants compare with the responses gathered through online polling?
3 Are policy ratings consistent across different local authorities?
4 Do participants' policy recommendations change as a result of deliberation?
5 Do participants' ratings of the importance of co-benefits predict policy recommendations?
6 Do participants' self-reported social identity, sense of efficacy and ratings of group deliberation quality predict policy recommendations?
7 How do participants' self-reported social identity and efficacy compare between The Strategy Room and responses gathered through online polling?
A range of statistical tests were used to address these questions. In all cases, statistical significance is p<.05 or p<.001.
In the chapters that follow we describe key findings from the pilot study (Wave 1), representing preliminary results from an ongoing analysis.
Who took part in The Strategy Room pilot?
Between January and March 2023, The Strategy Room was piloted in 12 local authorities: Barnet, Barnsley, Bromley, Cornwall, Lambeth, Luton, Medway, Merton, Reading, Sandwell, Southend-on-Sea and Wandsworth. The majority of these councils are based in the south east of England.
Over 66 individual sessions, 638 people experienced The Strategy Room. Each council committed to at least three sessions to ensure they collected enough data to justify taking part. Some participants already knew each other – for example, participants in Barnet were all members of the local climate assembly, while Sandwell council delivered multiple sessions for local community groups. Other councils opted for completely open attendance and hosted multiple sessions with local residents who had no pre-existing relationships. Participation was entirely voluntary and all participants received a £20 voucher for their contribution.
Figure 4: demographic information including gender, age and ethnicity
This figure presents demographic information using three charts:
- Gender distribution: A bar chart showing Frequency on the Y-axis (0-350) and Female, Male, Non-binary, Not disclosed on the X-axis. Female shows the highest frequency, followed by Male.
- Age distribution: A bar chart showing Frequency on the Y-axis (0-100) and age ranges (14-17, 18-25, 26-35, 36-45, 46-55, 56-65, 66-75, 75+, Not disclosed) on the X-axis. The 36-45 and 46-55 age groups show the highest frequencies.
- Participation demographics: high-level ethnic groups, excluding White: A horizontal bar chart showing Percentage on the X-axis (0-10) and ethnic groups (Asian, Asian British or Asian Welsh; Black, Black British, Black Welsh, Caribbean or African; Mixed or Multiple ethnic groups; Other ethnic groups; Prefer not to answer) on the Y-axis. Each ethnic group has two bars: "The Strategy Room" (blue) and "Ethnic group distribution, England and Wales, 2021" (green). Black, Black British, Black Welsh, Caribbean or African shows the highest percentage for The Strategy Room participants, significantly higher than the England and Wales average.
Categories are derived from guidance issued by the Office for National Statistics and the UK Census. Comparison with UK Census made on the basis of data published by ONS.
Given the geographical skew of the pilot towards the South East, we reviewed how the demographics of our participants compared with the UK general population. Overall The Strategy Room sample of participants had a higher representation of female-identifying individuals and participants from minority ethnic backgrounds than the national average.
Figure 5: a group in Wandsworth playing The Strategy Room
A two-part image showing participants interacting with The Strategy Room. The left image shows an elderly woman with white hair and a blue cardigan speaking animatedly in a group setting, gesturing with her hands. The right image is a close-up of a hand interacting with a tablet displaying a "Survey" screen about community energy investment options.


Section 1: results from The Strategy Room pilot (Wave 1)
1. Overall results
Most policies have strong support, particularly those with clearly framed community benefit.
We found all eight core net zero policies explored in The Strategy Room received an overall high level of support, with six out of the eight policies scoring above seven (Figure 6). This is consistent with previous polling on net zero policies.
The four most popular policies were 'Sustainably-sourced food for public services', 'Community energy', 'Town centre redevelopment' and 'Energy-efficient social housing'. The least popular policies were 'Energy-included rent' (scoring 6.4), 'EV investment' (scoring 6.6) and the two fairness-adjusted travel policies. Grouping the results into the broader categories of 'Would recommend', 'Neutral' and 'Would not recommend' – a format typically used in national polls – shows that all of the policies received more than 80% support (Figure 7).
Policy preferences, as a whole, were consistent across age and gender apart from a significantly higher level of support for 'Supermarket ratings' from women in comparison to men (scoring 7.5 and 6.7, respectively).
Figure 6: support for different measures: average ratings for each policy
This bar chart shows the average ratings (0-10, from 'Would not recommend' to 'Strongly recommend') for various net zero policies. Policies are listed on the Y-axis: Sustainably-sourced food in public services, Community energy, Town centre redevelopment, Efficient social housing, Supermarket ratings, Subscription transport, *Subsidised e-car club, EV investment, Energy-included rent, *Car trade-in scheme. All policies received average ratings above 6, with Sustainably-sourced food in public services and Community energy scoring highest.
*Fairness-adjusted policies
Participants were asked: which strategies would you recommend for this area? This is your final vote. (Average rating, Total sample = 638 participants)
Figure 7: overall policy support for different measures
This stacked bar chart shows the overall policy support in percentages (0-100) for various net zero policies, categorized into 'Would recommend' (green), 'Neutral' (grey), and 'Would not recommend' (purple). Policies are listed on the Y-axis: Sustainably-sourced food in public services, Efficient social housing, Community energy, Town centre redevelopment, Subscription transport, Supermarket ratings, EV investment, *Subsidised e-car club, Energy-included rent, *Car trade-in scheme. All policies show a high percentage for 'Would recommend' (over 80%), with very small 'Neutral' and 'Would not recommend' segments.
*Fairness-adjusted policies
Participants were asked: which strategies would you recommend for this area? This is your final vote. (Total sample = 638 participants)
Within each module, participants expressed clear preferences for some policies above others (Figure 8). In all cases, these differences were statistically significant and suggested a preference for implementing more community-oriented (green) over individualistic (blue) policies. As this coding is coarse, further work is needed to confirm the reason for the observed differences. We plan to dig into this finding with a values-based analysis later in the year.
"This isn't just about money, it's about community."
Participant from Lambeth, Heat and Food session
Figure 8: overall policy ratings within Food, Heat and Travel modules
This bar chart compares overall policy ratings (0-10, from 'Would not recommend' to 'Strongly recommend') across three modules: Food, Heat, and Travel. Within each module, policies are grouped and coloured by whether they are 'Community' (green) or 'Individualistic' (blue) in framing.
Food Module:
* Sustainably-sourced food in public services (Community) - Highest rating
* Supermarket ratings (Individualistic) - Lower than the community-oriented policy
Heat Module:
* Community energy (Community) - High rating
* Efficient social housing (Community) - High rating
* Energy-included rent (Individualistic) - Lowest rating in Heat module
Travel Module:
* Town centre redevelopment (Community) - High rating
* Subscription transport (Community) - High rating
* *Subsidised e-car club (Individualistic)
* EV investment (Individualistic)
* *Car trade-in scheme (Individualistic) - Lowest rating in Travel module
Generally, community-oriented policies have higher average ratings than individualistic policies.
*Fairness-adjusted policies
Participants were asked: which strategies would you recommend for this area? This is your final vote. (Average rating, total sample = 638 participants)
We applied a coarse coding to categorise the policies into those that had a more 'community-minded' (green) and more 'individualistic' (blue) framing in the testimonials that participants viewed in The Strategy Room. The differences between policy ratings were statistically significant within each module.
Previous research into net zero policies suggests that the public is more likely to support policies that are perceived as fair. We explored this issue through two fairness-adjusted policies related to EV investment. Similar to the core EV investment policy, both adjustments were among the least popular recommendations. Participants showed a preference for the 'Subsidised e-car club' over 'Car trade-in scheme' (scoring 6.17 and 6.66, respectively).
Qualitative data from session observations suggests that this could be due to perceived issues with the design of these policies. In general, discussions were balanced and recognised the potential benefits of the adjustments as well as key reservations. As seen in previous research on attitudes to net zero, we found that interpretations of fairness varied across individuals and locations. Several participants expressed concerns that increases in council tax would disadvantage those who were already struggling, felt that trade-in schemes would not be enough to cover costs towards new cars and emphasised that investment in public infrastructure should be more of a priority.
Overall, this provides an emerging consensus about where councils should start on the path to net zero and suggests that adopting a community-framing for net zero policies could help increase public support.
"Yes it is fair to subsidise the e-car club because the end result is for everyone."
Participant in Luton, Travel and Food session
"There are enough services that people are paying [for] already."
Participant in Bromley, Travel session
2. Local differences
Local context seems to make a difference to policy preferences.
We observed differences in the policies recommended by participants across the 12 local authorities from the pilot. While the most highly rated policies overall – 'Community energy' and 'Sustainably-sourced food in public services' – were consistently popular, others showed variation depending on location. We observed this trend across all three policy modules.
Taking food policies as an example, we can see that the values for each local authority were tightly clustered around the mean for the sample (Figure 9). This is contrasted by the higher degree of dispersion from the sample mean of policy ratings for 'Supermarket ratings'.
Figure 9: average ratings for food policies by local authority
This figure shows two scatter plots with error bars comparing average ratings for 'Sustainably-sourced food in public services' and 'Supermarket ratings' across different local authorities. The Y-axis represents 'Strongly recommend' (0-10). Each point represents a local authority.
Sustainably-sourced food in public services:
Points for various local authorities (Barnsley, Cornwall, Bromley, Lambeth, Luton, Medway, Reading, Merton, Sandwell, Wandsworth, Southend-on-Sea) are tightly clustered around a high average rating, indicating consistent popularity.
Supermarket ratings:
Points for the same local authorities show a wider dispersion, suggesting more variation in preferences across locations.
The chart also indicates "Variation within the local authority", "Local ← authority average", and "Average across all locations".
The vertical lines for each of the points provide an indication of the spread of the data using a 95% confidence interval – offering a visual indication of overlap in participants' ratings across councils. The horizontal black line indicates the average value between all locations.
*Barnet is not represented in this plot, because they did not run any sessions with the Food module.
The differences in participant preferences were most striking for travel policies. We explored this interaction by focusing on a subset of local authorities: Sandwell, Southend-on-Sea and Reading. All three locations have similar, relatively high levels of car ownership (between 70-75%) but showed marked differences between the travel policies they endorsed.
Participants in Sandwell were more in favour of 'EV investment' for their final recommendations than in Reading and Southend-on-Sea, while 'Subscription transport' was more popular among participants in Southend-on-Sea than Reading. 'Town centre redevelopment' was the only policy that had similar levels of support among participants in all three locations (Figure 10).
Figure 10: comparison of travel policy ratings in Reading, Sandwell and Southend-on-Sea
This figure shows three scatter plots with error bars comparing average ratings (0-10, from 'Would not recommend' to 'Strongly recommend') for travel policies across Reading, Sandwell, and Southend-on-Sea.
EV investment:
Sandwell participants show higher support for 'EV investment' compared to Reading and Southend-on-Sea.
Town centre redevelopment:
All three locations show similar levels of support for 'Town centre redevelopment'.
Subscription transport:
Southend-on-Sea participants show higher support for 'Subscription transport' compared to Reading.
The chart also indicates "Variation within the local authority", "Local ← authority average", and "Average across all locations".
The vertical lines for each of the points provide an indication of the spread of the data using a 95% confidence interval – offering a visual indication of overlap in participants' ratings across councils. The horizontal black line indicates the average value between all locations.
Larger sample sizes and further statistical tests will be needed to confirm if these observed trends are significant. This preliminary analysis suggests the importance of local authorities engaging their residents in understanding the best path towards net zero, rather than relying on national polling as a guide for what will be acceptable in their area.
3. Co-benefits of policies
Health and community cohesion co-benefits are the strongest predictors of whether people recommended with net zero policies.
We found that people place a high value on all four of the net zero co-benefits tested in The Strategy Room. At the end of each session participants rated how important each co-benefit was in relation to the overall final policies recommended by the group. Health co-benefits received the highest score (8.6), followed by jobs, community cohesion and then poverty reduction (Figure 11).
Figure 11: the importance of co-benefits for participants' endorsements of net zero policies
This bar chart shows the average importance ratings (0-10, from 'Not at all important' to 'Very important') for four co-benefits: Health, Jobs, Community, and Poverty. Health received the highest average rating, followed closely by Jobs and Community, with Poverty reduction having the lowest but still significant rating.
Participants were asked: please rate how important these things are to you. (Average rating, total sample = 638 participants)
"I think this stuff is not only helping the environment but helping people with their general health and wellbeing, and if that helps the environment too, then great."
Participant in Lambeth, Heat and Food session
"I would like cars to be all electric because it is healthier for the younger kids breathing it [air] in."
Participant in Sandwell, Travel session
Taking this a step further, we mapped the relationship between the four co-benefits and each of the eight core policies (Figure 12).
Overall the relationships between participants' support for policies and the co-benefits were all positive, indicating broadly that the more participants valued policy co-benefits relating to health, community cohesion, jobs and poverty, the more strongly they recommended net zero policies. The strength of these relationships varied depending on the policy. For example, placing higher importance on health and community cohesion was more strongly associated with support for 'Town centre redevelopment' and 'Sustainably-sourced food in public services' than placing high value on potential job creation, which was most strongly associated with 'EV investment' and 'Subscription transport'. Statistical models confirmed that these relationships were predictive and that health was the strongest statistically significant predictor of participants' policy preferences overall.
Figure 12: the relationship between support for co-benefits and support for policies
This heatmap-like visualisation shows the correlation between the four general co-benefits (Jobs, Health, Poverty, Community) and each of the eight core policies (Supermarket ratings, Sustainably-sourced food in public services, Energy-included rent, Efficient social housing, Community energy, EV investment, Town centre redevelopment, Subscription transport).
The color scale indicates:
* Dark green: Strong positive relationship
* Light green: Positive relationship
* White/Grey: No relationship
* Red: Strong negative relationship (not visible in this chart, implying all relationships are positive or neutral)
Key observations:
* Health and Community show strong positive relationships with 'Supermarket ratings', 'Sustainably-sourced food in public services', 'Efficient social housing', and 'Town centre redevelopment'.
* Jobs and Poverty show generally positive, but sometimes weaker, relationships across policies.
* 'EV investment' and 'Subscription transport' tend to have weaker positive relationships with most co-benefits, except for Jobs which shows a stronger positive link with 'EV investment' and 'Subscription transport'.
The visualisation shows the correlation between the four general co-benefits and each of the eight core policies. The dark green colour means that there is a strong positive relationship between the co-benefit and the policy, implying that the more important the co-benefit is to an individual, the more likely it is that they support the policy.
We also saw additional gains from more context-specific tailoring of co-benefits messaging. For 'Community energy', we asked participants to rate four more statements directly related to the policy. Of these, a co-benefit related to energy security – "it means we're protected against whatever madness is going on in the wider world" – was the strongest predictor of policy support. It accounted for significantly more variation than any of the general co-benefits.
This aligns with findings from late 2022 that showed a large increase in public concern about energy security. Despite mounting evidence that the public responds to co-benefits messaging, 35% of councils still fail to incorporate this explicitly into their climate work.
Our findings reinforce the value of tailoring messaging to appeal to citizens' wider concerns. Politicians and local councils should specifically articulate the value of net zero for communities' health and community cohesion as well as jobs. There is also value in extra nuance that responds to more timely public interests such as concern about energy security.
"Given the impact of the war in Ukraine, generating energy locally would be very good."
Participant from Medway, Heat and Food session
Section 2: the value and limitations of more innovative public engagement on net zero
1. Comparisons with YouGov polling
Participants in The Strategy Room were in general more positive about net zero policies than the respondents in an online poll.
Figure 13: a comparison between The Strategy Room and YouGov polling
This bar chart compares policy recommendation ratings (0-10, from 'Would not recommend' to 'Strongly recommend') between "The Strategy Room" participants and "YouGov" online poll respondents. Each policy has three bars: one for The Strategy Room (green), one for YouGov (purple), and one for the 'Difference' between the two samples (yellow).
Policies are listed on the Y-axis: Community energy, Sustainably-sourced food in public services, Efficient social housing, EV investment, *Subsidised e-car club, Supermarket ratings, *Car trade-in scheme, Town centre redevelopment, Subscription transport, Energy-included rent.
For most policies, The Strategy Room participants show higher recommendation ratings than YouGov respondents, indicated by the yellow 'Difference' bar extending to the right. The largest differences are seen in 'Sustainably-sourced food in public services' and 'Town centre redevelopment'. EV-related policies (*Subsidised e-car club, EV investment, *Car trade-in scheme) show smaller differences.
*Fairness-adjusted policies
Participants were asked: which strategies would you recommend for this area? This is your final vote. (The Strategy Room total sample = 638; YouGov total sample = 2,009)
Where statistically significant differences were found, the excess of the differences is coloured in yellow.
We ran an online poll to help us understand how the recommendations made by participants in The Strategy Room differ from other approaches typically used by decision-makers to understand public preferences. Opinion polling platforms are scalable and relatively cheap, but their ability to present complex information is often limited.
Figure 13 shows the direct comparison of policy recommendations between The Strategy Room participants and the online sample. We found that 7 out of 10 policies were more highly recommended by The Strategy Room participants than YouGov's online sample and that these differences were statistically significant. Only three of the travel policies were recommended equally between the two samples, showing no significant differences – these all related to the introduction of EVs ('EV investment', 'Subsidised e-car club' and 'Car trade-in scheme').
The largest differences between the two samples were for 'Sustainably-sourced food in public services' and 'Town centre redevelopment', with participants endorsing policies by 1.5-2 points (scale 0-10) more than the online sample.
More research is needed to understand how to account for these differences. For example, some of the differences may be explained by the geographical bias in our sample while others are likely to be the result of the method itself. The Strategy Room was deliberately designed to prime local identity and activate group efficacy. The policy information was also delivered in a more creative way, which may have allowed participants to engage with the content from a different perspective. Table 4 provides an overview of the differences between the two approaches.
Table 4: comparison of The Strategy Room design vs online polling by YouGov
|
The Strategy Room |
YouGov polling |
| All participants rate all policies (across three modules) |
|
|
| Policies are presented in a random order |
|
✔ |
| Information about policies presented in written format |
|
✔ |
| Information about policies presented as videos and actor testimonials |
✔ |
|
| Participants are able to ask clarifying questions |
✔ |
|
| Participants are able to adjust their ratings after deliberation |
✔ |
|
| Participants are able to see the results of others in their group |
✔ |
|
As The Strategy Room experience moves beyond piloting and is played by more people across the UK, it may be possible to disambiguate some of these factors.
2. The benefits of deliberation
Deliberation has an effect on policy ratings, and people's satisfaction with the group's recommendations.
Other approaches that involve the public in deliberating policies have shown that individuals' opinions can shift after discussion. The Strategy Room offers multiple opportunities for participants to deliberate as a group; both after policies are initially introduced using short video testimonies, as well as a discussion at the end of each module – directly before and after which participants provide their final ratings for each policy (Table 1).
Comparisons of the pre- and post-discussion policy recommendations revealed small but statistically significant changes in the level of support for three out of eight core policies discussed by participants. There was an increase in the strength of endorsement for 'Sustainably-sourced food in public services' (from 8.92 to 9.13), 'Community energy' (from 8.26 to 8.40) and 'Efficient social housing' policies (from 7.73 to 7.88), which were among the most popular policies overall. This finding is in line with the size of opinion changes reported in other research that uses similar interactive polling methods.
At the end of each session, participants in The Strategy Room evaluated the quality of deliberation in their group. Statistical modelling confirmed that deliberation quality was a significant predictor of participants' satisfaction with the final set of policy recommendations (Figure 14). This means that if discussions allow for exchange of diverse opinion and equal participation amongst the group, it is likely that participants will be satisfied with the outcomes of the process.
Figure 14: the relationship between deliberation quality and overall satisfaction with group recommendations
This scatter plot (adapted) illustrates the relationship between deliberation quality and overall satisfaction with group recommendations. The X-axis represents 'Deliberation quality' (0-6, from 'Strongly disagree' to 'Strongly agree'), and the Y-axis represents 'Satisfaction' (0-10, from 'Not at all satisfied' to 'Very satisfied'). Data points are grouped into hexagons, with darker blue indicating higher density of data points. A positive linear trend line shows that as deliberation quality increases, so does the satisfaction.
Participants were asked: please rate how satisfied you are with the recommendations that you made and to what extent do you agree or disagree with these statements? (Total sample = 638 participants)
The chart is an adapted version of a scatter plot. The line represents the relationship between deliberation quality and satisfaction, which shows that as deliberation quality increases, so does the satisfaction. Data points underlying this relationship are grouped into hexagons (dark blue = high density of data points; white = no data points).
Qualitative data from session observations suggests that participants particularly valued the opportunity to discuss these issues with people they wouldn't traditionally engage with.
The time for discussion of each separate policy in The Strategy Room is between 5 and 10 minutes and takes place in one session, which is shorter than typically seen in other deliberative approaches (such as citizens' assemblies) which involve multiple engagements over many days. This suggests that under some circumstances, even relatively limited discussion can create opportunities for opinion change and may also increase satisfaction with the outcomes of deliberative policy processes. It paves the way for more experimentation with new creative deliberative approaches to public engagement. Future work should focus on understanding the relationship between deliberation time, deliberation quality and people's willingness to change their mind.
"I listen to the radio and read about climate change but the issues are very complicated. This was good because we got to discuss everything separately."
"It was good to hear other views – of people who I don't usually spend time with."
Participants from Wandsworth, Travel and Food
3. The benefits of innovative engagement experiences
Creative digital tools for net zero public engagement make climate policy more accessible, and may increase participants' sense of climate efficacy and local identity.
There is public appetite to engage in discussion and decision-making about net zero policy. We found that local residents from all pilot locations enjoyed taking part in The Strategy Room, with 87% rating the experience as 8/10 or higher (Figure 15). The average enjoyment rating was 8.9/10. Turnout rates were high and participants often expressed a desire to attend additional sessions.
Qualitative data collected during the sessions indicates that participants specifically valued the opportunity to deliberate with others and to learn about complex issues that mattered. They also appreciated that content was presented in an interesting, accessible way and that the experience was interactive.
Figure 15: enjoyment of The Strategy Room experience
This donut chart shows the distribution of participant enjoyment ratings for The Strategy Room experience. The segments represent ratings of 10, 9, 8, and <8. The largest segment indicates a high proportion of participants rated the experience 10 or 9.
Participants were asked: please rate how much you enjoyed your experience in The Strategy Room today.
Not at all enjoyable (0) <> very enjoyable (10).
(Total sample = 638 participants)
"Can I do the transport one? How many of these are there? I want to go to all of them!"
Participant from Merton, Heat and Food session
"Video was a nice way to hear about the policies."
Participant from Southend, Travel and Food session
"I learnt a lot. There were things I didn't know much about."
Participant from Wandsworth, Heat and Food session
We found that The Strategy Room participants reported a stronger sense of local identity (average = 5.3 out of 7) and rated their ability to make changes to reduce the impact of climate change more highly (average = 4.1 out of 5) than those who assessed net zero policies through the online poll. These differences were statistically significant (Figure 16).
Figure 16: comparison of local identity and efficacy scores between The Strategy Room participants and online respondents
This figure presents two bar charts comparing scores for "Connection to local identity" and "Ability to reduce climate change" between "The Strategy Room" participants (green) and "YouGov" online respondents (purple).
Connection to local identity:
The Y-axis ranges from 'Strongly disagree' (1) to 'Strongly agree' (7). The Strategy Room participants show a higher average rating for connection to local identity compared to YouGov respondents.
Ability to reduce climate change:
The Y-axis ranges from 'Strongly disagree' (1) to 'Strongly agree' (5). The Strategy Room participants also show a higher average rating for their perceived ability to reduce climate change compared to YouGov respondents.
Participants were asked: to what extent do you agree or disagree with these statements? Average rating, total sample = 638 participants)
Participants rated Local identity and Efficacy on scales from 1-7 and 1-5, respectively, based on accepted psychological measures.
"That was so interesting, it makes me feel we can do something."
Participant from Sandwell, Heat and Food session
"Communities leading the way gives me hope as we can get frustrated waiting for government. Also it might bring people together."
Participant from Medway, Heat and Food session
These differences might be the result of the specific design of The Strategy Room, which was informed by psychological theories that emphasise the role of social identity and a sense of efficacy as prerequisites to engaging in pro-environmental action. It's also possible that individuals with higher dispositional levels of local identity and efficacy were more likely to seek out and participate in civic initiatives relating to net zero and climate change. Empirically, our findings are in line with those of previous research that has shown place-based participatory initiatives can bolster participants' sense of efficacy and engagement with environmental action.
During the pilot, The Strategy Room was played by a wide range of participants with different interests and needs, including community groups with learning disabilities. Anecdotally, council officers from the locations in our pilot reported that The Strategy Room participants helped them to go beyond the groups that typically took part in environmental public engagement activities.
Our demographic data also indicates The Strategy Room reached a more diverse audience than the national average, showing a higher representation of female-identifying individuals and participants from minority ethnic backgrounds, although this may reflect the geographical bias towards the south east of England. There was also broad representation from the young to the old, with representation being especially notable for younger age brackets (18-35) a demographic that can be difficult to reach.
"It was a nice bunch of people. There was a diversity of age and ethnicity."
Participant from Wandsworth, Heat and Food session
"We're going beyond usual suspects; we've managed to engage different, more diverse participants."
Local authority climate officer
Section 3: recommendations for decision-makers
To build support for net zero policies
Change how you commission public engagement
- Invest in scaling up public participation on net zero policies – there is appetite from people to engage in discussions about how this can lead to better communities, and an opportunity to generate deeper understanding of net zero and a stronger mandate for policy action.
- National governments and local councils should work together to commission innovative approaches to public engagement, making the most of constrained financial resources. Establishing a Citizen Participation Unit in the Department for Energy Security and Net Zero to coordinate and channel resources to local climate teams would help demonstrate the governments' commitment to putting people at the centre of net zero policy.
- When commissioning public engagement activities, be open to a wider range of methods and tools – don't assume a citizens' assembly, survey or focus group is the right approach.
- Develop new digital tools for public engagement, like The Strategy Room, that can be used by many local authorities – with some customisation or adaptation for local needs – and which allow the sharing of insight between different areas. Network associations like the Local Government Association (LGA) and UK100 have a crucial role to play in coordinating these efforts.
- Ensure activities allow space for people to discuss options together in a structured way while also capturing individual preferences – this is likely to increase satisfaction with the outcomes of consultations.
Change how you frame and communicate net zero policies
The UK Government has promised a guiding framework for net zero messaging to support public engagement. This guidance should encourage decision-makers to:
- Frame net zero policies in terms of their community rather than individualistic benefit, showing how the benefits will be shared.
- Communicate the wider co-benefits of net zero policies. In particular, emphasise general benefits related to health as well as incorporating people's current concerns like energy insecurity into messaging.
- Communicate complex policies through creative approaches such as video storytelling and interactive activities. This will build public understanding and help communities discuss policies on their own terms to broaden reach beyond the 'usual suspects' and build buy-in at the local level.
Change how you tailor net zero policy at national and local levels
- The UK Government should remove legislative barriers to support local-level implementation of policies that have widespread support, specifically community energy schemes which are popular with the public but currently hampered by energy market regulation and lack of progress with the Local Electricity Bill.
- The UK Government needs to lead by example with strategic commitments to help councils decarbonise the housing stock and food supplies they're responsible for, if it expects people to change how they heat their homes and the food they eat.
- Improving the energy efficiency of social housing and mandating sustainably-sourced food for public institutions are two popular policies that would benefit from streamlined national-level schemes and access to long-term local funding for councils who could spearhead implementation.
- Local councils should focus their effort on tailoring travel policies in particular – this is where there's most variation between preferences at a local level, particularly around EV investment. Make space to discuss fairness concerns, leveraging people's input to design the most appropriate local fairness adjustments.
Section 4: next steps
This report provides the results from the first wave of analysis for the data collected during the pilot phase of The Strategy Room.
Additional analyses will be published in 2024. Nesta is also developing plans for a nationwide rollout of The Strategy Room, which will give other locations an opportunity to get involved. More details can be found online at www.nesta.org.uk/project/strategyroom.
Alongside this, we are launching an interactive platform (www.strategyroom.uk) where data on people's choices is open and available for anyone to explore, and for local councils to download and use for decision-making. Data will continue to be updated regularly as more people participate in the project.

Appendix
The results in this report are preliminary findings from an ongoing analysis. The full details of the study and analyses can be found in the pre-registration on the Open Science Framework website: https://osf.io/enxuj/?view_only=5511896b5a59426ca4da782b8306527f.
Table A1: the four contextual co-benefits rated by participants for the community
| Co-benefits |
| Personal financial gain: "The really good thing about this project is that I'm making money from it." |
| Local jobs: "There are new jobs in the area." |
| Local pride: "Knowing that our energy is coming from just literally over there [is] something to be proud of." |
| Protection against insecurity: "It means we're protected against whatever madness is going on in the wider world." |
Table A2: overview of net zero policies and corresponding labels used in all figures
| Original policy heading |
Label |
| More electric car infrastructure and vehicles |
EV investment |
| Town centre redevelopment |
Town centre redevelopment |
| Subscription-based service for all local transport |
Subscription transport |
| Energy-included rents |
Energy-included rent |
| Improving the energy efficiency of social housing |
Energy-efficient social housing |
| Community renewable energy schemes |
Community energy |
| Environmental rating for supermarkets |
Supermarket ratings |
| Local and sustainably-sourced food in public services |
Sustainably-sourced food in public services |
| Subsidised electric vehicle car clubs |
*Subsidised e-car club |
| Trade-in scheme for petrol and diesel cars |
*Car trade-in scheme |
*Fairness-adjusted policies
Endnotes
Acknowledgements
We would like to thank our colleagues at Fast Familiar and UCL's Climate Action Unit for their partnership on this project: Dan Barnard (Director and Researcher), Rachel Briscoe (Writer and Researcher), Kris De Meyer (Neuroscience Associate), Joe McAlister (Computational Artist), Delme Thomas (Artistic and Delivery Associate). We are grateful to the following for their role in creating The Strategy Room experience: Mirko Febbo (data visualisation), Abla Kandalaft and Patrick Oddi (films), Guy J Sanders (image design), Sodium Films (documentation film), Kiana Wheeler (animation). The characters in the game were played by Paul Brendan, Endy McKay and Johndeep More.
Thank you to our three co-design local authorities (Lambeth, Sandwell and Southend-on-Sea) who provided early-stage feedback and conducted lo-fi testing with local residents to help us refine the design: Stuart Ashmore, Luke Bullivant, Hope Carpenter, Jo Gay, Steph Li, Dan Lloyd, Wayne Saggers, Paul Smith and Cassidy Travis. Jo Banks, Claire Dawson, Elaine Equeall, Nick Hayden, Yisum Heneghan, Megan Hermes, Dylan Katuwawala, Lucy Kirk, Amy Mallett, Jo Miskin, Peter Moore, Yogita Popat, Parisa Wright and Kat Wysocka helped to organise sessions in other locations.
We are very grateful to the following people who provided advice during the development of The Strategy Room: Karen Agbabiaka, Kim Doell, John Hughes, Elspeth Kirkman, Stuart McKinnon, Toby Park, David Pencheon, Stephen Rimmer, Camille Stengel, Rebecca Wilkes and Oliver Zanetti. Others who contributed to the project include Jyoti Banerjee, Ben Davis, Hilary Jennings, Daniel Jonusas, David Thorne, and Lisa Woynarski – thank you!
We are also very grateful for the valuable support on this project from our colleagues at Nesta's Centre for Collective Intelligence Design, particularly Naoise Boyle, Tom Feltwell, Scott Hunterson, Rita Marques, Joana Murta Rosa, Nicol Nyika and Lewis Westbury.
A special thank you to all participants in the pilot and early user testing.
58 Victoria Embankment
London EC4Y 0DS
+44 (0)20 7438 2500
[email protected]
@nesta_uk
nesta.uk
www.nesta.org.uk
Nesta is a registered charity in England and Wales with company number 7706036 and charity number 1144091. Registered as a charity in Scotland number SCO42833. Registered office: 58 Victoria Embankment, London EC4Y 0DS.
ISBN: 978-1-916699-02-1


