About Nesta
We are Nesta, the UK's innovation agency for social good. We design, test and scale solutions to society's biggest problems. Our three missions are to give every child a fair start, help people live healthy lives and create a sustainable future where the economy works for both people and the planet.
For over 20 years, we have worked to support, encourage and inspire innovation. We work in three roles: as an innovation partner working with frontline organisations to design and test new solutions, as a venture builder supporting new and early stage businesses and as a system shaper creating the conditions for innovation. Harnessing the rigour of science and the creativity of design, we work relentlessly to change millions of lives for the better.
Find out more at nesta.org.uk
If you'd like this publication in an alternative format such as Braille or large print please contact us at [email protected]
Authors
Oli Berry, Shaan Jindal, Katy King, Steve Buckley (from TrustPower/Loop)
Executive summary
Our field trial aimed to generate real-world evidence on the impact of advice to lower boiler flow temperatures
Lowering flow temperatures is a promising approach to reducing gas consumption of combi-boilers in domestic homes. Lab experiments and modelling have shown that lowering boiler flow temperatures can reduce gas consumption. However, to date there has been a lack of real-world evidence from randomised controlled trials to support turning down flow temperatures. Generating evidence from real-world trials could mean more effective energy saving advice for householders. In this trial we wanted to test the impact of season-specific advice, where flow temperatures are lowered more during warmer months – which has the potential to increase gas savings.
We ran a field randomised controlled trial with 61,000 Loop customers to evaluate the impact of flow temperature advice between January and April 2023
We partnered with Loop, an energy advice company, which helped us implement a randomised controlled trial. The trial involved 61,000 of its customers who used gas. Loop sent emails to its customers with a link to an online tool we had developed. This provided actionable advice on how to lower flow temperatures.
We found that month-specific advice resulted in small but statistically significant gas savings
We found that sending customers three emails containing month-specific advice resulted in a statistically significant decrease in daily gas consumption. We also found that the month-specific advice resulted in a statistically significant increase in the proportion of participants that reported they had turned down their boiler flow temperature in the last three months. However, we didn't find any statistically significant differences for those who received the one-off advice in a single email.
We didn't find any differences between the proportion of participants that self-reported that they were thermally uncomfortable between the treatment groups and the control group, or any differences in daily electricity consumption.
Our results indicated that month-specific advice could result in greater gas savings
Although many in our trial had already turned down their boiler flow temperatures, the month-specific advice did result in a small gas saving. This indicates that there are more savings to be made. We didn't find evidence of compensatory behaviour relating to thermal comfort or daily electricity consumption, suggesting that the advice can provide savings with little cost to household occupants.
Introduction
Lowering boiler flow temperatures has been demonstrated in modelling and lab experiments to reduce gas consumption but there is a lack of real-world evidence
There is theoretical evidence that lowering the flow temperature of condensing gas boilers could significantly reduce household gas use, through an increase in boiler efficiency. Nesta has confirmed these theoretical savings by conducting a lab experiment with Salford University's Energy House, and through modelling commissioned from Cambridge Architectural Research (CAR). This research suggests that lowering boiler flow temperatures from 80°C to 60°C will result in an 8%-9% saving on total household gas use.
Although this research found that lower flow temperatures reduced household gas use due to an increase in boiler efficiency (the mechanism expected to drive the effect), it also found a proportion of the gas saving was due to room temperatures being slightly lower than usual.
This may occur as lower flow temperatures result in a lower heat output from radiators, causing rooms to take longer to warm up. Lower room temperatures could also occur due to the way common thermostats are designed to switch off the boiler before the room has reached the desired temperature. Some thermostats are designed like this with an assumption that the residual heat from radiators (heated with a higher flow temperature) will continue heating the room to the desired temperature once the boiler has been switched off.
Trialling advice on lowering boiler flow temperatures in the field could also help identify if there are any behavioural backfire effects that reduce the magnitude of gas savings
As lowering the boiler flow temperature may also impact the room temperature, it's vital to test this advice with a large sample of real households over a longer period. The research conducted so far can't tell us whether household occupants would notice the small change in room temperature, nor how they'd behave if they did. It's important to better understand this issue as households that notice a temperature difference may compensate for it in suboptimal ways that could reduce, eliminate or even reverse the gas savings. For example, they may turn the thermostat up, extend their heating hours or use electric heaters.
All households will use their heating system and react to changes in their room temperature in different ways that lab experiments and modelling can't fully account for. This is particularly the case when these decisions are poorly informed (for example, households may increase the thermostat to compensate for lower flow temperatures, which could lead to higher overall usage). We hope that conducting research with a large sample of real households, who are likely to display a variety of heating behaviours, will improve our understanding of the impact of lower flow temperatures on gas use and thermal comfort.
There is the potential for greater energy savings by providing season-specific flow temperature advice each month, instead of a one-off adjustment
Based on the Nesta-commissioned lab experiment and modelling mentioned above, the UK government, advice-giving organisations, charities, energy companies and many other organisations recommended that households could lower their flow temperatures to 60°C over the winter of 2022-2023, to save energy and money. Nesta also promoted this advice through its Money Saving Boiler Challenge. This one-size-fits-all recommendation will meet the heat demand and heating preferences of almost all UK homes and households in peak winter conditions, while still increasing boiler efficiency. However, in milder conditions, many homes could be sufficiently heated with a flow temperature of 55°C or below for a further increase in boiler efficiency.
That means it's possible that households could make further gas savings if encouraged to use an even lower flow temperature in the milder autumn and spring months. However, the same questions relating to household comfort, gas savings and behaviour in response to changes in comfort still need to be investigated.
Therefore, it's important to not only investigate the impact of the mainstream flow temperature advice on gas use and thermal comfort, but also understand the impact of giving flow temperature guidance tailored to the time of year. This could improve the advice that's currently being given and further reduce household gas use.
Better understanding the real-world impacts of lowering flow temperatures can improve the advice that households receive
If we can better understand the impacts of flow temperature advice on household gas use and thermal comfort, we may be able to improve the recommendations that are currently given by organisations promoting this advice. An additional and novel evidence source could also help reassure consumer advice organisations that are currently hesitant in promoting this energy-saving advice.
This report sets out our field trial in which we explored the extent to which gas savings play out in the real world when customers are emailed with advice. It also tests whether this advice causes any negative compensatory behaviour from customers.
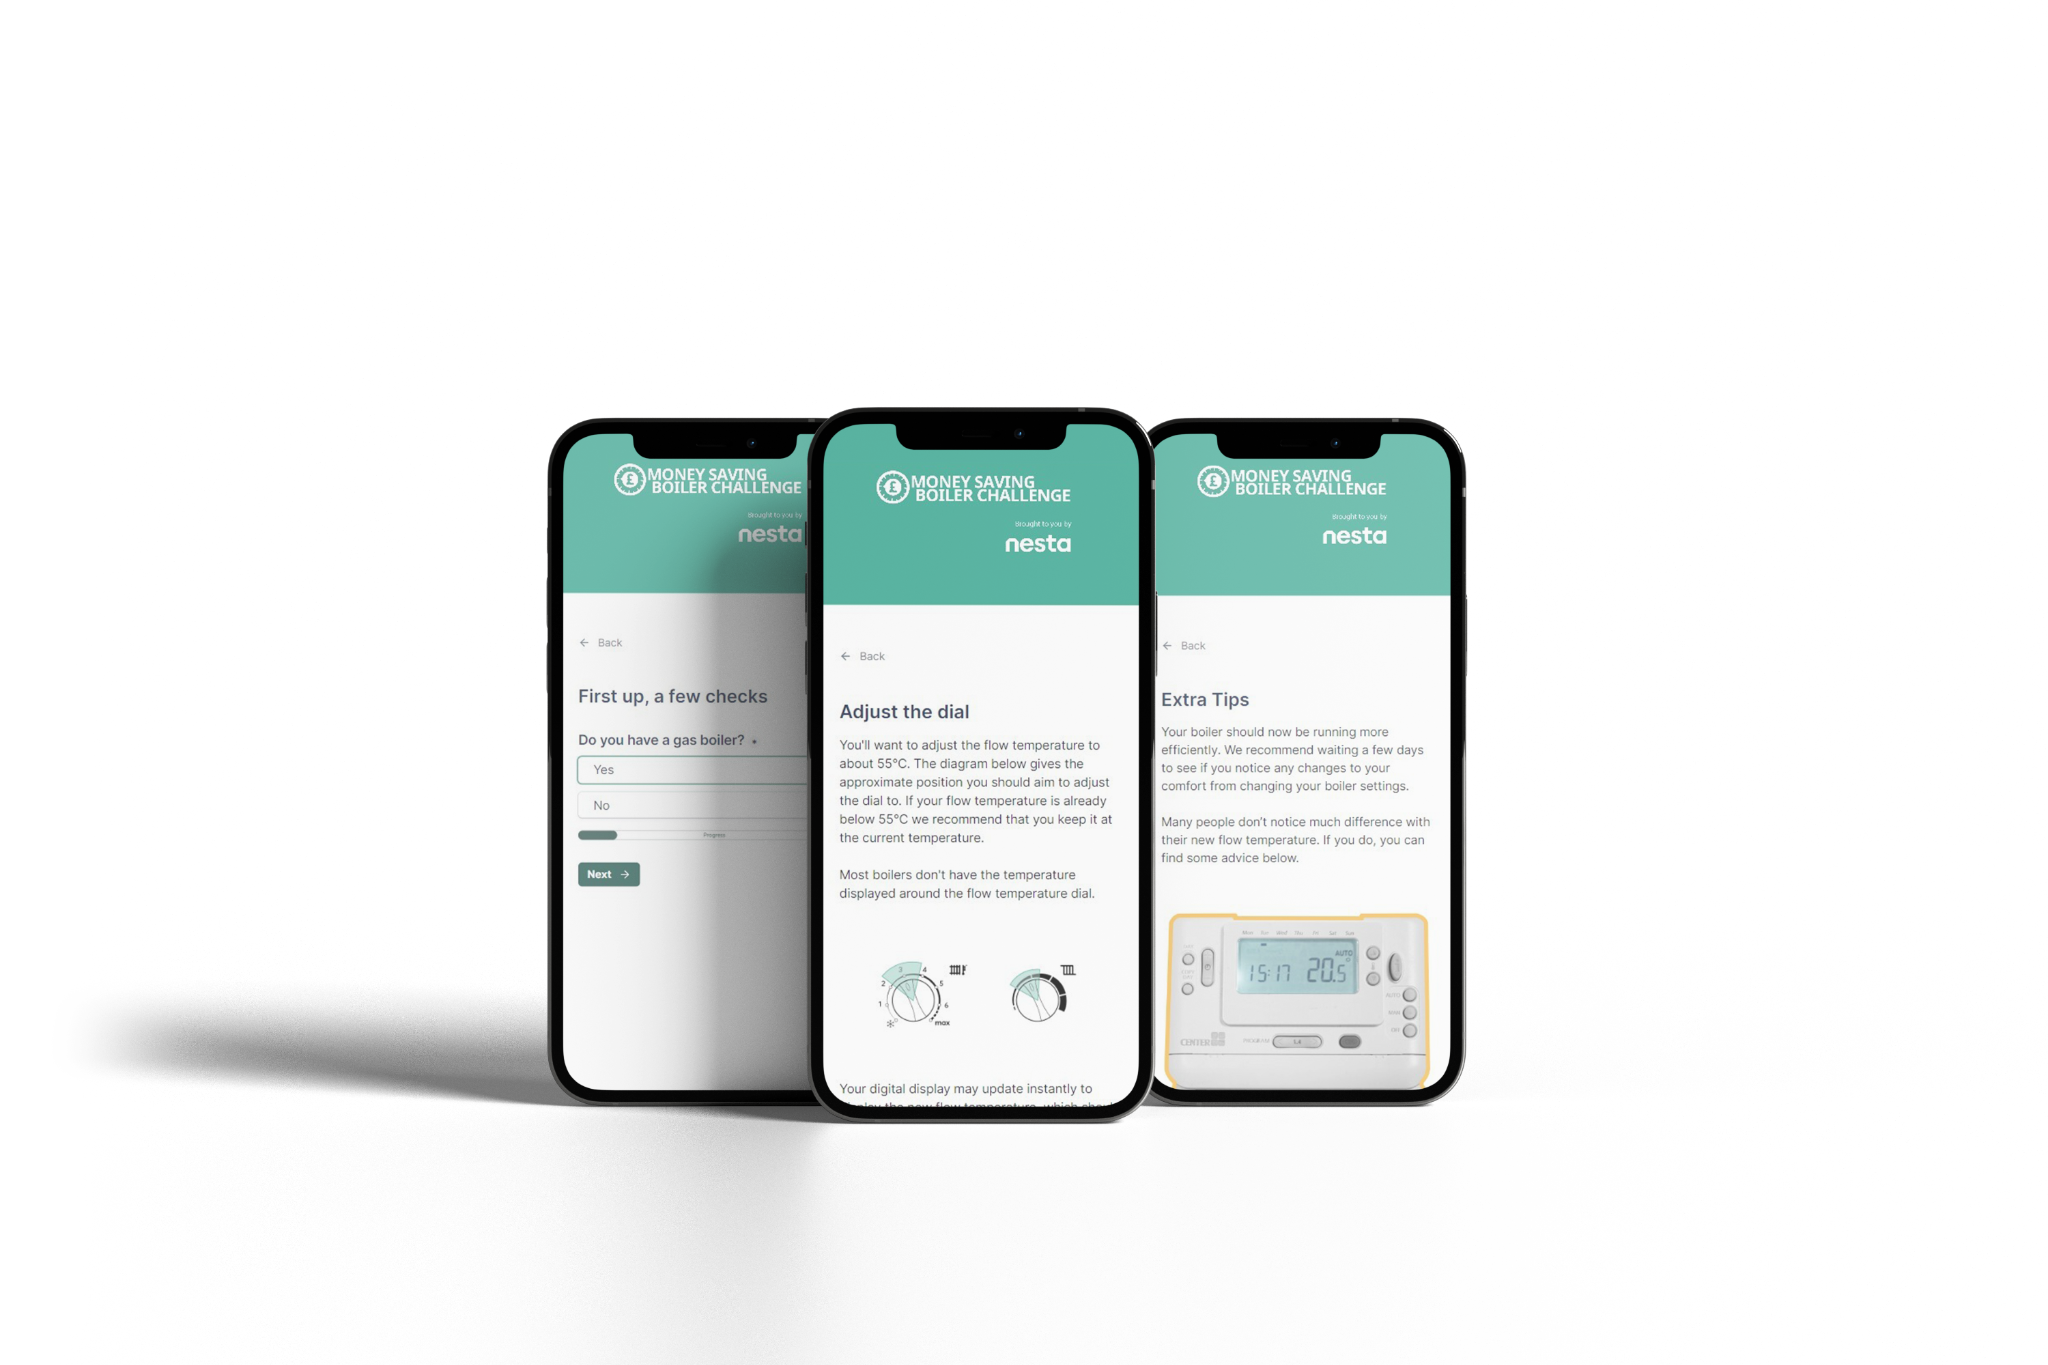
We developed an online tool that provided boiler optimisation advice
Our team at Nesta developed an online tool that included a step-by-step guide to support households with lowering their boiler flow temperature. This included instructions tailored to a user's boiler control configuration. The tool aimed to help overcome barriers individuals face when lowering their boiler flow temperature, and increase the chance of individuals doing so successfully. We were also able to account for different central heating systems, such as excluding those with hot water tanks.
Figure 1. Illustration of our online tool
In previous research, we found that our tool helped people turn down their boiler flow temperatures, but we couldn't demonstrate the impact on gas consumption
Our approach to evaluating the effectiveness of boiler optimisation advice
In a pilot randomised controlled trial (RCT) conducted in 2022, we found that the tool resulted in more people turning their boiler flow temperatures down. When we asked the 7,002 participants on the trial whether they had turned their boiler flow temperature down in the last two weeks, 181 survey respondents in the treatment group said they had, versus 97 in the control group. The email increased the proportion of participants who self-reported turning their boiler down (34% in the treatment group versus 19% in the control group – this difference was statistically significant). This research indicated that there was potential for our tool to help people turn down their flow temperatures.
Our pilot trial only lasted two weeks, which was insufficient time to be able to confidently measure the impact on gas consumption. In this trial, we wanted to measure the impact of our intervention across a three-month period, which would capture a variety of different external temperatures.
In this research we wanted to test the impact of providing month-specific advice on gas consumption
The tool we tested in the pilot provided advice to turn down boiler flow temperatures to 55°C in spring. However, many homes may require flow temperatures of 60°C in the depths of winter, and most homes may be suitable for heating with flow temperatures of 50°C or lower in spring. In this trial we also wanted to explore whether providing these month-specific flow temperature recommendations could result in greater energy savings, without compromising the thermal comfort of occupants.
We partnered with Loop to run a field trial to evaluate the impact of flow temperature advice on household gas use and thermal comfort
To facilitate this research, we partnered with Loop, a company that provides a Smarter Meter app. This is the same company with whom we conducted the pilot trial in 2022. Loop's app provides customers with advice on how to reduce their home energy consumption, based on their smart meter data. Loop was instrumental in enabling our trial to work as it provided access to its customers' smart meter data and administered our intervention.
Loop also helped collect survey data for our trial. Loop regularly surveys its customers, which provided us with an opportunity to ask participants about their thermal comfort and heating behaviours.
Our trial aimed to evaluate the effectiveness of two variants of our tool using an RCT
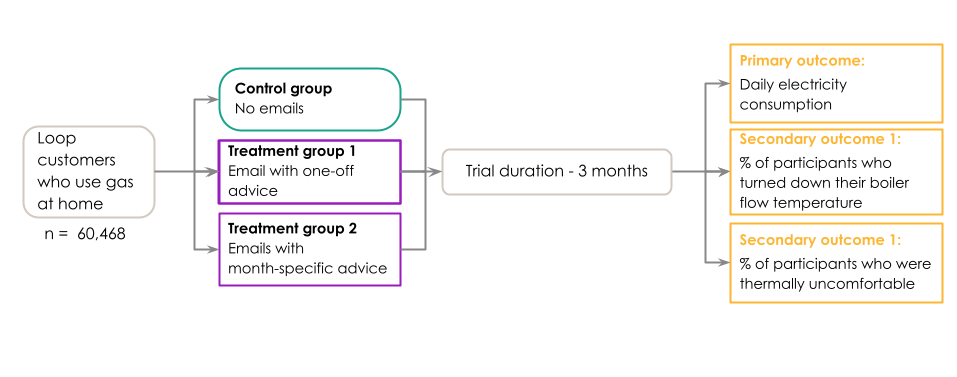
To assess the impact of month-specific advice and one-off advice, we used a three-armed RCT:
- 60°C advice (Treatment 1) - participants in this arm received an email sent at the start of the trial (January) recommending they lower their boiler flow temperature to 60°C. This email contained a link to an online tool to help individuals adjust their flow temperature.
- Month-dependent advice (Treatment 2) - participants in this arm received three emails over the trial period, each with a different recommendation for their boiler flow temperature to match the season. They were recommended a flow temperature of 60°C at the start of the trial (the same intervention as the 60°C arm), 55°C at the start of March and 50°C at the start of April. Each email also contained a link to an online tool to help individuals adjust their flow temperature to the correct temperature for the month.
- Control arm - participants in this arm didn't receive any emails with advice on changing boiler flow temperature settings over the course of the trial period.
Our RCT was conducted between January and April 2023
Our sample comprised 60,468 customers of Loop who use gas in their homes and had successfully connected their smart meter with the Loop app, from 21 January to 21 April 2023 (a 90-day period). Each participant was randomly allocated to be in the control group, Treatment 1 (one-off advice) or Treatment 2 (month-dependent advice). The participants in the trial were unaware they were receiving a novel intervention during the trial period.
Figure 2. Summary of trial design
We aimed to answer the following questions:
Research Question 1 (primary)
Does the receipt of boiler optimisation advice result in changes in daily gas consumption between trial conditions?
Research Question 2 (secondary)
Does following the boiler optimisation advice result in changes in self-reported thermal comfort between trial conditions?
Research Question 3 (secondary)
Does the receipt of boiler optimisation advice (either of the Treatments) result in changes in self-reported boiler setting adjustment between trial conditions?
Research question 4 (exploratory)
Does the receipt of boiler optimisation advice increase the prevalence of compensatory (backfire) behaviours between trial conditions?
Research question 5 (exploratory)
Does the receipt of boiler optimisation advice result in changes in daily electricity consumption between trial conditions?
Loop provided us with smart meter data that enabled us to quantify the impact of our intervention on daily gas consumption and daily electricity consumption. To measure whether participants turned down their boiler flow temperatures and their thermal comfort, we used surveys at the end of each month of the trial duration.
Findings from our randomised controlled trial
We found that the month-specific advice resulted in a statistically significant decrease in daily gas consumption – but the one-off advice did not
We used an Intention-To-Treat (ITT) analysis to estimate the effect of our interventions on daily gas consumption. In an ITT analysis, we analysed the impact of the intervention (in this case, the emails sent to Loop customers with a link to our tool) on all people in the treatment groups, regardless of whether they followed the advice, opened the email, or even received it.
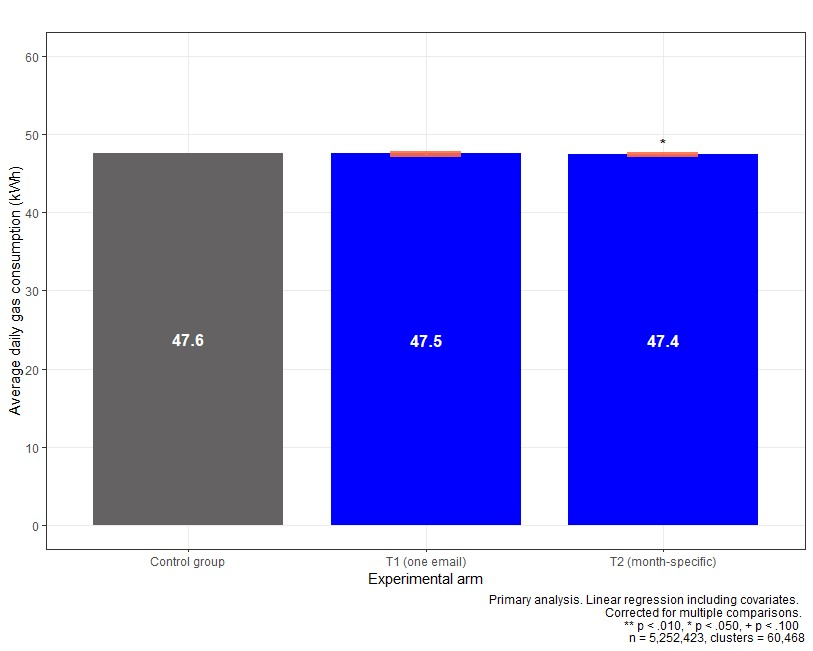
We found that the month-specific advice resulted in a decrease in daily gas consumption of 0.209 kWh (p = .009), which is a decrease of approximately 0.4% compared to the control group. We did not find a statistically significant difference between the one-off advice and the control group (p = .295). We didn't find a statistically significant difference between Treatment 1 and Treatment 2 (p = .122).
Given that other research suggests that lowering boiler flow temperatures from 80°C to 60°C will result in an 8%-9% saving on total household gas use, the estimated impact of our intervention is smaller. However, it is highly likely that not everyone in the treatment group followed our advice, meaning that the average per participant would be less than 8%-9%.
Moreover, many of the customers in the control group may have already lowered their flow temperatures because of other advice. For example, the Money Saving Boiler Challenge, a national consumer-facing campaign encouraging households to lower their flow temperature, launched three and a half months before the trial started. The advice was also shared by energy companies, advice-giving organisations (such as Which? and Martin Lewis's MoneySavingExpert), the UK government, and others before and during the trial. Relatedly, the cost of living and energy crises created an increased interest in novel energy saving advice from households and media outlets. This meant a greater proportion of the general population may have already encountered and enacted this advice than would usually be expected.
Figure 3. Results from our primary analysis (outcome is daily gas consumption)
We found that the month-specific advice resulted in a statistically significant increase in the proportion of participants that turned down their boiler flow temperature in the last three months – but the one-off advice did not
To help assess whether our interventions resulted in more people turning their flow temperatures down, we sent all participants a survey after the end of the trial. We asked participants whether they had ever changed the flow temperature settings on their boiler, whether they had increased it or decreased it, and how often they changed it.
The chart below shows when respondents turned down their flow temperature by experimental arm. The chart helps visualise how prevalent lowering flow temperatures was across all three experimental arms. Sixty-four percent of respondents (3,173 out of 4,935 respondents) said that they had lowered their flow temperature at some point.
Figure 4. When survey respondents had most recently lowered their flow temperatures (only displaying those who had lowered their flow temperature; n = 3,162)
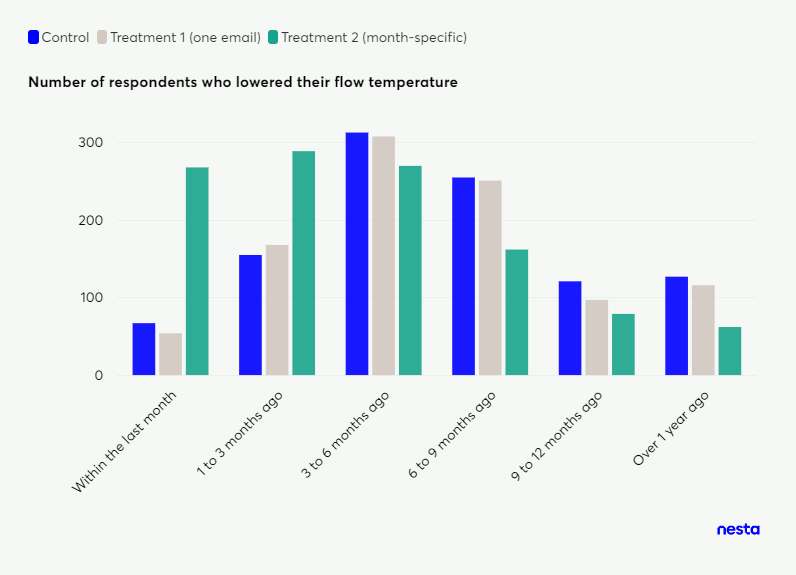
For our trial, the key timing of turning down flow temperatures was within the 90-day trial period. Thirteen percent of the participants in the control group who responded to our survey (222 of 1,699 respondents) turned down their flow temperature within the last three months.
We found a statistically significant increase in the proportion of respondents who lowered their flow temperature in the last three months for Treatment 2 (month-specific advice) compared to the control group (p < .001). However, we did not find a difference between Treatment 1 and the control group (p = .398). There was a significant difference between Treatment 2 and Treatment 1 (p < .001).
Figure 5. Results from our secondary analysis (outcome is proportion of participants that turned down their boiler flow temperature in the last three months)
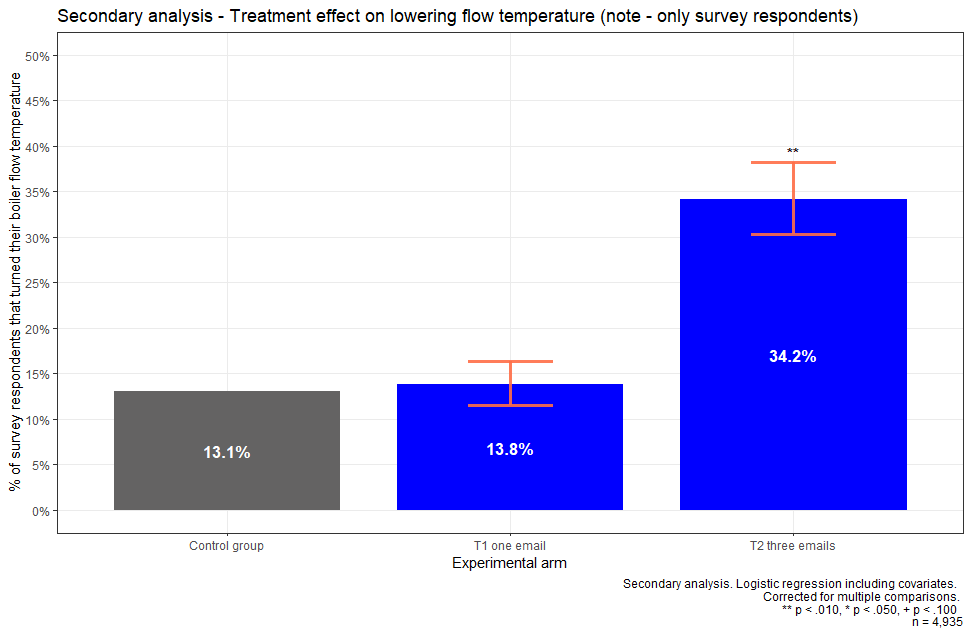
This analysis is based on the responses we received in our final survey. It's important to be clear that we received only 4,935 survey responses from customers of Loop that had gas central heating – considerably less than our total sample size. This means that there may be bias in our estimates because of response bias. For example, it may be the case that people who turned their flow temperature down in the treatment groups were more likely to respond to the survey, which would suggest a greater proportion of individuals turned down their flow temperature than reality. This means that we can't be certain the results are solely a result of the intervention.
Our survey helped provide more information on how respondents tended to use their boiler flow temperatures
We asked a range of questions in the survey administered at the end of the trial to find out more about how people interact with their boiler flow temperatures. For example, we found that 3% of respondents (138 of 4,935 respondents) had raised their flow temperatures. When we asked if these participants then kept it at the new raised temperature, only 47% (65 of 138 respondents) said they did.
On the other hand, of those who had lowered their flow temperature, 77% (2,536 of 3,173 respondents) said that they kept it at the new temperature, suggesting that they didn't tend to adjust it once it had been lowered.
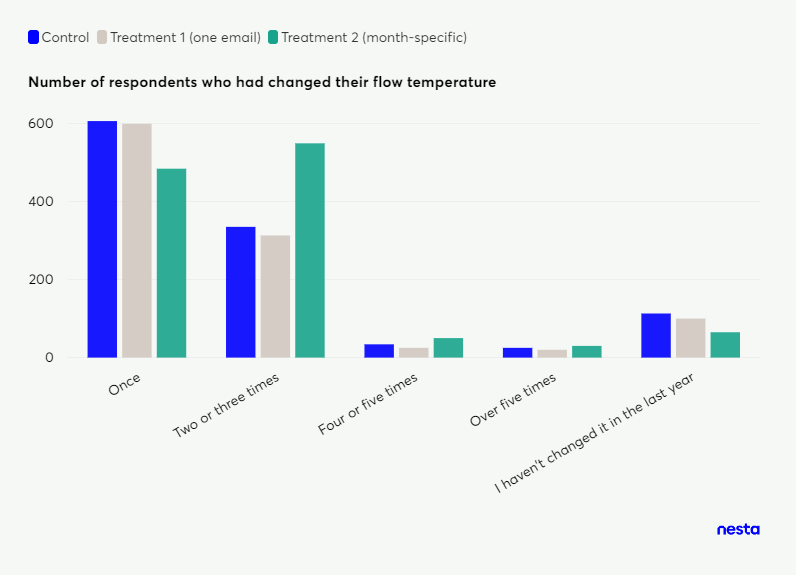
We also asked participants how often they changed their flow temperature. In the control group, most participants either changed their flow temperature once (54%; 606 of 1,113 respondents) or two or three times (30%; 335 of 1,113 respondents). For those that received the month-dependent advice, the proportion of respondents changing their flow temperature once was lower than the control group (41%; 484 of 1,178 respondents); but the proportion of those changing it two or three times was greater (47%; 549 of 1,178 respondents). This further corroborates that month-dependent advice resulted in participants changing their flow temperatures multiple times. As shown below, it also appeared to marginally reduce the number of participants who had never changed their flow temperature.
Figure 6. How often survey respondents changed their flow temperatures (n = 3,348)
We didn't find any differences between the proportion of participants that self-reported that they were thermally uncomfortable between the treatment groups and the control group
One area we wanted to explore in our trial was the impact of lowering flow temperatures on thermal comfort. We were aware that lower flow temperatures could mean that heating up homes to the desired temperature may take longer, but also that less heat would radiate out of radiators over a given period.
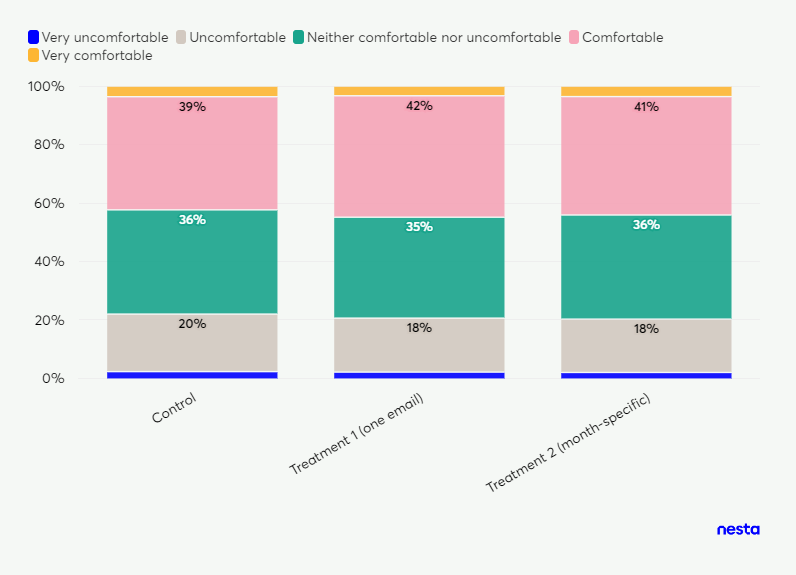
We sent surveys after each month so that we could ask participants about how thermally comfortable they were in the past month. This ranged from "Very comfortable" to "Very uncomfortable". The chart below displays these results.
Figure 7. Survey respondents' thermal comfort across all three months of the trial (n = 15,953)
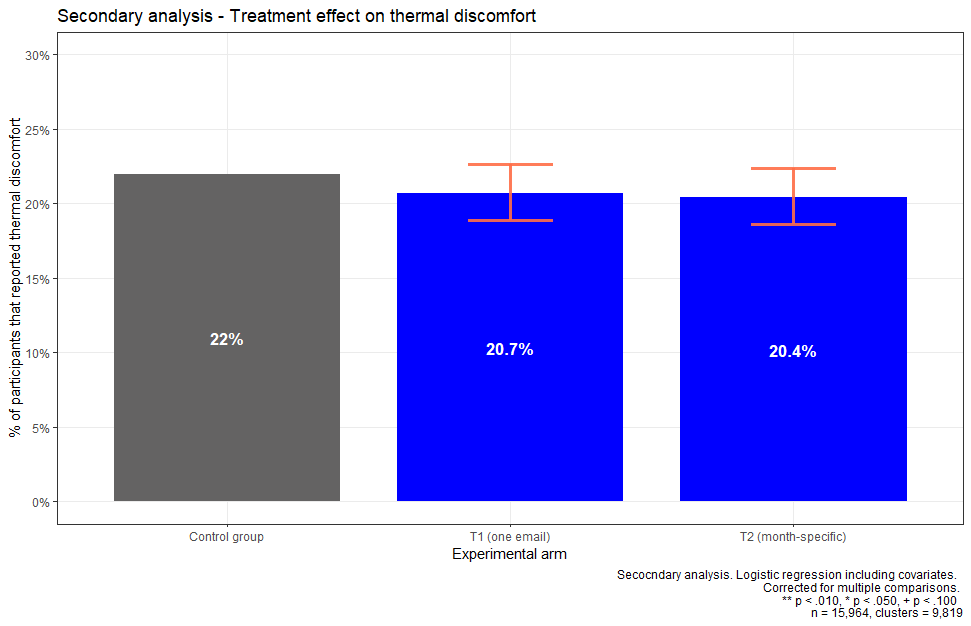
We were particularly interested in whether participants were uncomfortable with the temperature of their home, specifically if they were very uncomfortable or uncomfortable. We found no statistically significant difference between the control group and Treatment 1 (p = .192) or Treatment 2 (p = .108). There was also no significant difference between Treatment 1 and Treatment 2 (p = .759).
Figure 8. Results from our secondary analysis (outcome is proportion of participants reporting thermal discomfort in the last month)
We also asked participants in our survey about whether they had changed their behaviour in the past month – particularly behaviours that may be used to maintain thermal comfort. For example, we asked about whether participants changed the settings on their radiator values, the duration their heating was on, and thermostat settings. We found that the proportion of participants in each experimental arm who reported taking these actions was similar.
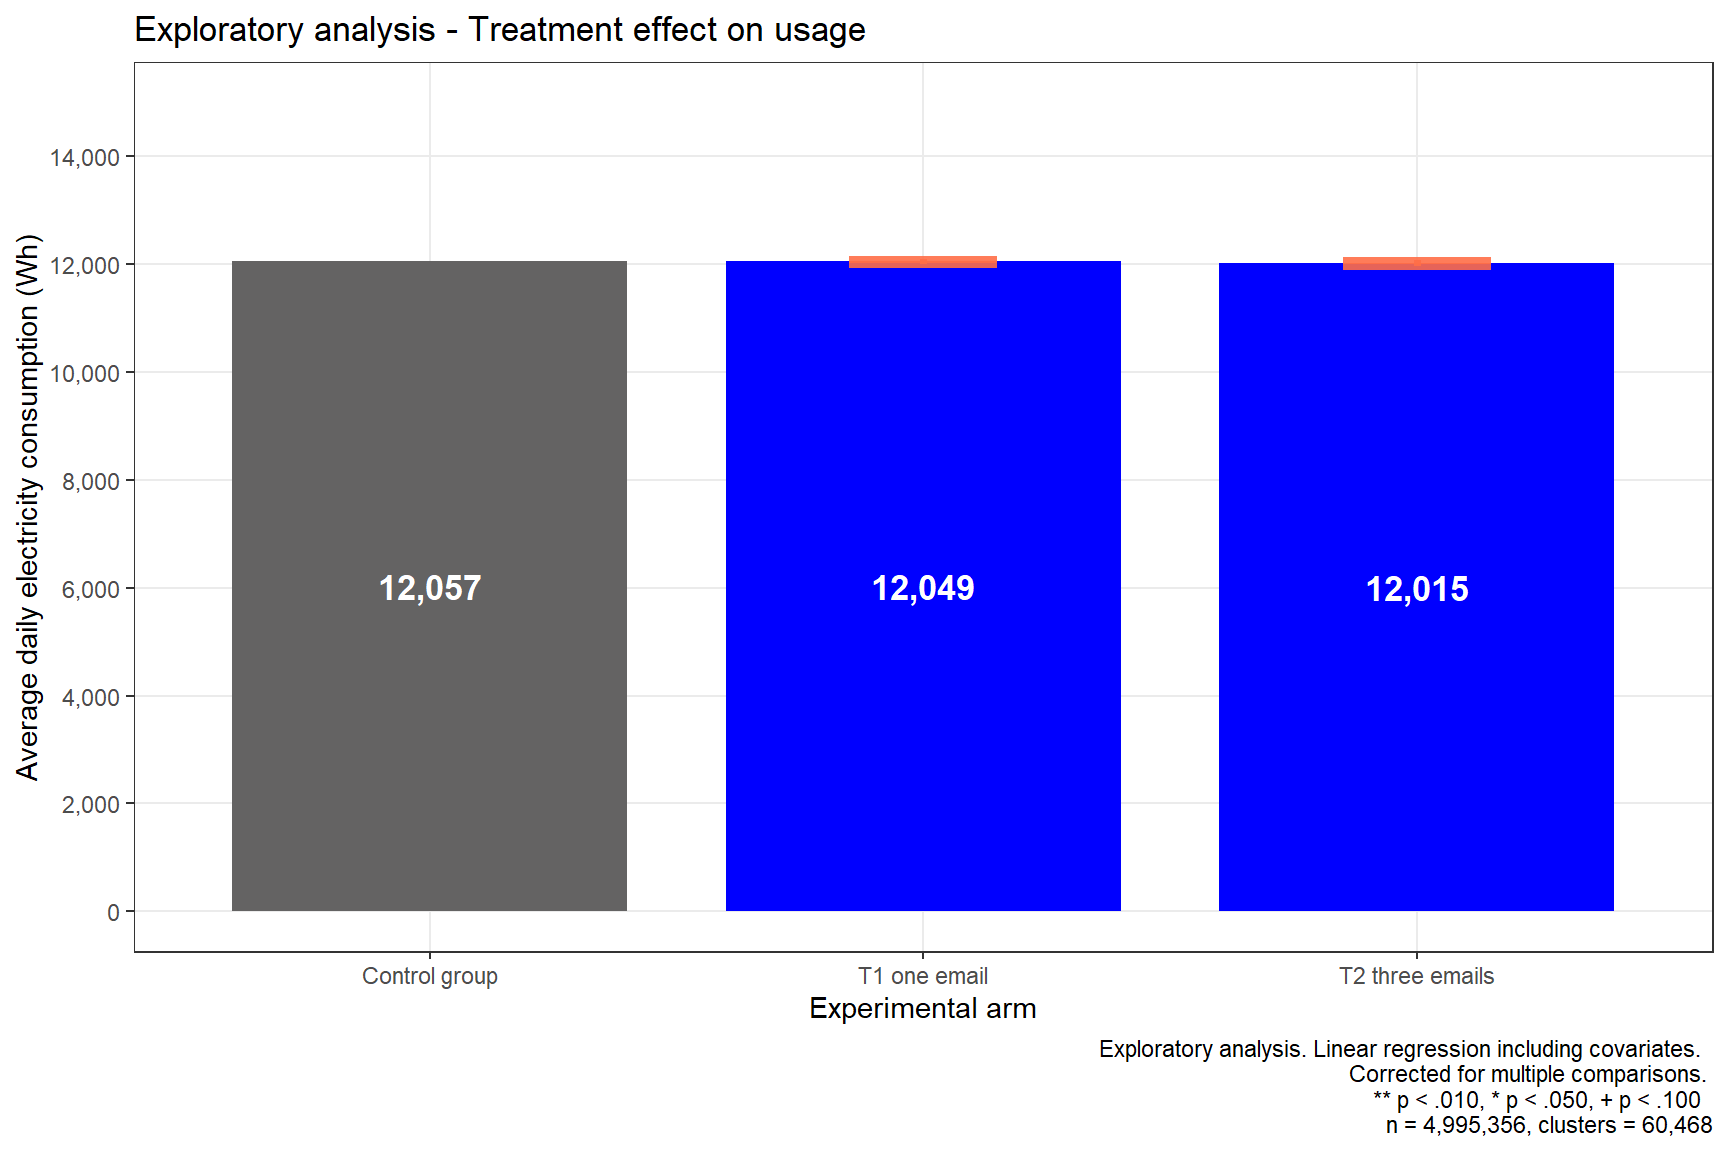
We didn't find any differences in daily electricity consumption between the treatment groups and the control group
One novel aspect of this research was to explore the impact of turning down flow temperatures on electricity consumption. Modelling by Energy Systems Catapult, commissioned by Nesta, indicated that turning down flow temperatures could increase household electricity consumption. This may occur as heating systems often run for longer periods of time at a lower flow temperature. This means the boiler's pump, which runs on electricity, may also run for longer periods.
Figure 9. Results from our exploratory analysis (outcome is daily electricity consumption)
There are some important limitations to our findings
Our results indicated that participants who received the emails with month-specific advice were more likely to lower their flow temperatures in the duration of the trial, resulting in a small reduction in daily gas consumption compared to those in the control group. However, there are some important points to raise about the limitations of these findings.
- Our findings may not be generalisable to the wider UK population. An important consideration is that Loop users may not be representative of the general population. They may have a higher interest in and openness to trialling heating efficiency measures, know slightly more about energy efficiency, have already enacted more energy efficiency measures and know about how to adjust different parts of their heating system correctly. They are also more likely to be homeowners and comfortable with using different technologies. This means that our findings may not be generalisable to the wider UK population, who may be less interested in following energy saving advice or feel less confident in doing so.
- Our trial does not directly estimate the impact of lowering flow temperatures because of the prevalence of those in the control group who had already lowered their flow temperature. Our survey findings indicated that the majority of respondents in the control group had lowered their flow temperature at some point. This means that our counterfactual group includes people who may have already reduced their daily gas consumption. Consequently, our estimated treatment effects are with reference to the current status quo, not households who have yet to lower their flow temperatures. It's likely that our treatment effects would be larger if our counterfactual group comprised only those who hadn't already lowered their flow temperature. On the other hand, given the prevalence of advice, our findings do help contribute evidence to the potential impact of future advice.
- Our analysis based on survey responses may be influenced by response bias. Only a small proportion of our participant sample responded to our surveys. We can't be sure how the remaining participants would have responded as it may be the case that they would have responded differently to those who did respond. Moreover, it may be that our interventions resulted in different types of people responding. For example, it may be that people who recently turned down their flow temperature are more likely to respond to the survey. This means that we need to be careful when interpreting the results from the survey data.
Conclusion
The results from our field trial indicated that the three emails with month-specific advice resulted in a lower daily gas consumption than the control group. Although the effect size is small (0.4% of daily gas consumption), it does demonstrate that there are potentially further gas savings to be made by providing month-specific advice. Our analysis of survey responses suggested that the advice may have helped some who had never adjusted their boiler flow temperature settings, as well as showing others that using seasonal flow temperatures could be beneficial. Even with a potentially large proportion of people having lowered their flow temperatures, more savings can be made.
We didn't find that the one-off email significantly changed behaviour or daily gas consumption. This may be because it provided advice to people who have already followed it, or it may be that repeated emails are required to change the behaviour of those who haven't lowered their flow temperatures yet.
Encouragingly, we didn't find evidence that our interventions made a significant difference to self-reported thermal comfort. It may still be the case that lowering flow temperatures results in a lower sense of thermal comfort. Our measurement of thermal comfort was self-reported and asked people about their sense of thermal comfort across a whole month, so may not detect small differences in thermal comfort.
We also didn't find evidence that our interventions changed daily electricity consumption. Small increases in electricity consumption from the boiler's pump running for longer periods of time may be expected, and it may be that an even larger sample size is required to detect this.
Lowering boiler flow temperatures remains one of the most important ways in which gas consumption can be reduced in homes with gas combi-boilers. The potential for 8%-9% reductions is not insignificant, especially considering the cost of doing so is negligible. Our trial indicates that there are potentially more savings to be made from helping increase the number of people who have turned their flow temperatures down, and by providing advice to turn down lower when the weather is warmer.
Technical annex
In this section, we report our pre-specified analysis for transparency.
Balance in covariates across experimental arms
As discussed in our pre-analysis plan, we used stratified randomisation to allocate participants to the control group or the treatment groups. We stratified on the region of participants' households (as defined by Nomenclature of Territorial Units for Statistics [NUTS] 1).
Below, we present descriptive statistics on the variables used as covariates in our regression models. Overall, we did not find evidence of material imbalance across the experimental arms. We note that all covariates were included in the regression models as controls, accounting for differences across experimental arms.
Table 1. Descriptive statistics for covariates
| Variable |
Control |
Treatment 1 (one email) |
Treatment 2 (month-specific) |
|
% (n) |
% (n) |
% (n) |
| Region |
|
|
|
| C |
5% (1,021) |
5% (1,018) |
5% (1,021) |
| D |
12% (2,338) |
12% (2,334) |
12% (2,347) |
| E |
9% (1,766) |
9% (1,771) |
9% (1,764) |
| F |
10% (1,977) |
10% (1,988) |
10% (1,978) |
| G |
9% (1,790) |
9% (1,795) |
9% (1,799) |
| H |
11% (2,201) |
11% (2,187) |
11% (2,192) |
| I |
6% (1,308) |
6% (1,306) |
7% (1,312) |
| J |
18% (3,709) |
18% (3,694) |
18% (3,706) |
| K |
10% (1,963) |
10% (1,963) |
10% (1,966) |
| L |
4% (905) |
4% (904) |
4% (904) |
| M |
6% (1,177) |
6% (1,180) |
6% (1,184) |
| Annual consumption band |
|
|
|
| 0 - 8,000 kWh |
25% (5,117) |
25% (5,128) |
25% (5,106) |
| 8,000 - 12,000 kWh |
30% (6,003) |
30% (5,943) |
30% (6,016) |
| 12,000 - 17,000 kWh |
26% (5,144) |
26% (5,167) |
25% (5,117) |
| 17,000+ kWh |
19% (3,891) |
19% (3,902) |
19% (3,934) |
| Length of time with Loop |
|
|
|
| 1 month less |
7% (1,464) |
8% (1,536) |
7% (1,452) |
| 1 to 3 months |
34% (6,934) |
34% (6,918) |
34% (6,958) |
| 3 to 6 months |
35% (7,022) |
35% (6,956) |
35% (7,026) |
| 6 or more months |
23% (4,735) |
23% (4,730) |
23% (4,737) |
| Proportion of emails from Loop read |
|
|
|
| None |
56% (11,214) |
55% (11,015) |
55% (11,045) |
| Some |
37% (7,451) |
38% (7,555) |
37% (7,527) |
| All |
7% (1,490) |
8% (1,570) |
8% (1,601) |
Descriptive statistics for outcomes
Below, we present the descriptive statistics for the three outcomes used in our pre-specified analysis.
Table 2. Baseline descriptive statistics for outcomes
|
Control group |
Treatment 1 (one email) |
Treatment 2 (month-specific) |
| N |
|
|
|
| Number of participants |
20,155 |
20,140 |
20,173 |
| n |
|
|
|
| Number of survey responses for final survey |
1,699 |
1,610 |
1,626 |
| n |
|
|
|
| Total number of survey responses for all three surveys |
5,643 |
5,202 |
5,299 |
| Primary outcome |
|
|
|
| Daily gas consumption (kWh) |
Mean = 47.6; SD = 34.9 |
Mean = 47.7; SD = 35.2 |
Mean = 47.5; SD = 34.7 |
| Secondary outcome |
|
|
|
| Proportion of participants that turned down their boiler flow temperature in the last three months |
13% n = 222 |
14% n = 222 |
34% n = 557 |
| Secondary outcome |
|
|
|
| Proportion of participants that reported that they were thermally uncomfortable in the last month |
22% n = 1,202 |
21% n = 1,072 |
21% n = 3,348 |
Results
Below, we present the results from our pre-specified analysis.
Primary analysis
Table 3. Results from our primary analysis; outcome: daily gas consumption (kWh) (60,468 participants [n = 5,252,423])
|
Primary analysis b(se) |
p-value |
95% Cls Lower |
Upper |
| Exp. arm (ref: Control group) |
|
|
|
|
| Treatment group 1 |
-0.085 (0.081) |
.295 |
-0.244 |
0.074 |
| Treatment group 2 |
-0.209 (0.081) |
.009* |
-0.367 |
-0.051 |
| Constant |
-15.1377 (0.317) |
- |
- |
- |
| Controls |
YES |
|
|
|
| N |
5,252,423 |
|
|
|
| R² |
0.713 |
|
|
|
| Adjusted R² |
0.713 |
|
|
|
Clustered SEs used (participants); number of clusters = 60,468. Controls include region, length of time with Loop, proportion of Loop emails read, annual consumption band.
+ p < .100, * p < .050, ** p < .010. Adjusted for multiple comparisons using the Benjamini-Hochberg step-up procedure.
Secondary analysis
Table 4. Results from our secondary analysis; outcome: proportion of participants that reported that they were thermally uncomfortable in the last month (among 4,935 survey respondents)
|
Primary analysis b(se) |
p-value |
95% Cls Lower |
Upper |
| Exp. arm (ref: Control group) |
|
|
|
|
| Treatment group 1 |
1.064 (0.103) |
.549 |
0.869 |
1.302 |
| Treatment group 2 |
3.452 (0.090) |
< .001** |
2.896 |
4.116 |
| Constant |
- |
- |
- |
- |
| Controls |
YES |
|
|
|
n
Pseudo R² (Cragg-Uhler)
4,935
0.094
Coefficients are odds ratios. Controls include region, length of time with Loop, proportion of Loop emails read, annual consumption band
+ p < .100, * p < .050, ** p < .010. Adjusted for multiple comparisons using the Benjamini-Hochberg step-up procedure.
Table 5. Results from our secondary analysis; outcome: proportion of participants that turned down their boiler flow temperature in the last three months (9,819 participants [15,964 responses])
|
Primary analysis b(se) |
p-value |
95% Cls Lower |
Upper |
| Exp. arm (ref.: Control group) |
|
|
|
|
| Treatment group 1 |
0.926 (0.059) |
.192 |
0.825 |
1.039 |
| Treatment group 2 |
0.911 (0.058) |
.108 |
0.813 |
1.021 |
| Constant |
- |
- |
- |
- |
| Controls |
YES |
|
|
|
n
Pseudo R² (Cragg-Uhler)
15,964
0.032
Clustered SEs used (participants); number of clusters = 9,819. Coefficients are odds ratios. Controls include region, length of time with Loop, proportion of Loop emails read, annual consumption band
+ p < .100, * p < .050, ** p < .010. Adjusted for multiple comparisons using the Benjamini-Hochberg step-up procedure.
Exploratory analysis
Table 6. Results from our primary analysis; outcome: daily electricity consumption (Wh) (60,468 participants [n = 4,995,356])
|
Exploratory analysis b(se) |
p-value |
95% Cls Lower |
Upper |
| Exp. arm (ref.: Control group) |
|
|
|
|
| Treatment group 1 |
-7.782 (26.993) |
.771 |
-60.777 |
45.034 |
| Treatment group 2 |
-41.516 (26.761) |
.121 |
-93.967 |
10.935 |
| Constant |
874.338 (93.564) |
- |
- |
- |
| Controls |
YES |
|
|
|
N
R²
Adjusted R²
4,995,356
0.581
0.581
Clustered SEs used (participants); number of clusters = 60,468. Controls include region, length of time with Loop, proportion of Loop emails read, annual consumption band.
+ p < .100, * p < .050, ** p < .010. Adjusted for multiple comparisons using the Benjamini-Hochberg step-up procedure.
Survey questions
This survey, and all other surveys used in the trial, can be found on the Open Science Framework page for this trial.
58 Victoria Embankment
London EC4Y ODS
+44 (0)20 7438 2500
[email protected]
@nesta_uk
f nesta.uk
www.nesta.org.uk
ISBN: 978-1-916699-08-3
Nesta is a registered charity in England and Wales with company number 7706036 and charity number 1144091. Registered as a charity in Scotland number SCO42833. Registered office: 58 Victoria Embankment, London EC4Y ODS.