We are Nesta.
The UK's innovation
agency for social good.
We design, test and scale solutions to society's biggest problems. Our three missions are to give every child a fair start, help people live healthy lives and create a sustainable future where the economy works for both people and the planet.
For over 20 years, we have worked to support, encourage and inspire innovation.
We work in three roles: as an innovation partner working with frontline organisations to design and test new solutions, as a venture builder supporting new and early stage businesses and as a system shaper creating the conditions for innovation. Harnessing the rigour of science and the creativity of design, we work relentlessly to change millions of lives for the better.
Find out more at nesta.org.uk
If you'd like this publication in an alternative format such as Braille or large print please contact us at: [email protected]
Authors
Max Woollard, Oliver Berry, Andrew Sissons, Chris Watling, Morley Coulson and Andy Regan
Acknowledgements
We would like to thank everyone who contributed towards the project, whether by reviewing the final report, providing support or contributing ideas during the trial, including Camille Stengal, Giulia Tagliaferri, David Bleines, Elin Price, Davinia Kiley, Tom Timothy, Olivia Potter, Gráinne Regan, Katy King, Laurence Hand, Peter Bullock and Shreya Garge.
We also would like to thank the following companies for their support: Langwith Research for their aid in conducting AI interviews, Vaillant UK for their technical support, and Kaluza for enabling remote control and data collection from participants' heat pumps.
Finally, we would like to thank all those who took part in the trial as participants. Without your willingness to volunteer, fill out weekly surveys, and contribute your feedback via interviews, this type of research can't happen. Thank you for supporting a greener future.
About OVO
We launched in 2009 with a belief that energy could be better. Since then, we've welcomed over a million members, planted 5 million trees and set our sights on helping to save the planet. In 2019, we launched Plan Zero our sustainability plan.
That's why we're helping UK homes on the Path to Zero. With a range of smart tech to choose from and our expert teams by your side, we can help you take steps to reduce your energy bills and our collective carbon footprint. Since 2015, we've planted 5 million UK trees in schools and communities across the UK on behalf of our customers.
So, whether you're just getting started or well on your way, join us on the path to energy that works better for you, your wallet and the planet.
Executive summary
This trial was conducted by OVO and Nesta to explore the integration of automated flexibility into a novel type-of-use tariff, Heat Pump Plus, aiming to reduce heat pump running costs and support grid decarbonisation. The project successfully demonstrated that automated load shifting of heat pump electricity consumption is achievable on consecutive days with high levels of customer satisfaction, with many participants not noticing our control.
Key findings
We remotely altered the setpoint temperatures of 58 participants' homes across the UK, increasing them by 1°C from their usual temperature during a preheating period, and then decreasing setpoints by 1°C from their usual temperature during the peak period.
- Significant load shifting: The trial successfully shifted approximately 30% of heating demand away from the 4pm-7pm peak period (Monday-Friday) between January and April 2025.
- High customer satisfaction: People who took part in the trial reported very high levels of satisfaction with their internal temperatures (88% satisfied) and often did not notice the automated control (60% reported no difference in comfort). Manual overrides were also very infrequent (1-2%).
- Willingness to automate: Participants consistently described having a positive overall experience taking part in the trial and expressed willingness to continue with the remote automation of their heat pump, though some expected additional financial incentives
Implications
This trial provides promising evidence for the viability of incorporating automated flexibility into type-of-use tariffs like Heat Pump Plus. These findings pose a number of implications for consumers, manufacturers and energy suppliers. The automation of heat pumps could further improve tariff offers to consumers by reducing the cost of electricity supplied and unlocking additional value by participating in flexibility markets. Additionally, the consent required for the automation of heat pumps could be bundled into type-of-use tariff agreements, enabling energy suppliers to be able to monitor and optimise the performance of heat pumps – providing benefit to consumers with lower running costs due to efficiency gains. To ensure these benefits are accessible to as many consumers as possible, manufacturers need to ensure that controls are interoperable and automatable by trusted parties. If these implications are realised, they could lend weight to system innovations such as multiple supplier arrangements, where consumers could adopt tariffs that cater to their specific assets and energy consumption behaviours.
1. Introduction
Project context
The UK government's commitment to achieving net zero by 2050, as outlined in the Climate Change Act 2008, necessitates a 100% reduction in carbon emissions compared to 1990 levels. A significant challenge lies within the residential sector, which accounts for 12% of the UK's total emissions. The most viable solution for addressing these emissions is the electrification of heat, primarily through the widespread adoption of heat pumps. Currently, the largest barriers to heat pump adoption are considered to be the upfront cost of installation and their running costs. Promising routes to reducing running costs are the rebalancing of levies to reduce the spark gap, increasing heat pump coefficient of performances (COPs) and the use of innovative tariff types.
This trial explored incorporating automated flexibility into a novel new tariff type, a type-of-use tariff offered by OVO called Heat Pump Plus. Users of Heat Pump Plus receive a flat rate tariff of 15p/kWh - but only on the electricity consumed by their heat pump. On average, users of Heat Pump Plus could save £440 per year when compared to a standard variable tariff. This considerably lowers the running cost of a heat pump compared to typical electricity prices, further bolstering the benefits for those choosing to install a heat pump over a fossil fuel boiler. There could be even further reductions to running costs from using heat pumps flexibly. Stakeholders that participated in CREDS (heat pump flexibility expert workshop) broadly agree that heat pump flexibility will be highly automated in a future business-as-usual scenario, and limited by avoiding negatively affecting thermal comfort. Previous research has shown that automated heat pumps can be used as flexibility assets with high levels of acceptance from participants. The fundamental gap in existing research has been around how to consistently harness this flexibility in a reliable, long-term manner that provides acceptable levels of comfort and significant savings for heat pump owners.
The benefits of successfully developed automated flexibility are significant to both consumers and suppliers. In return, suppliers are able to shift the electricity that they sell to times when generation is cheaper and greener. At a grid level, the mass transition to heat pumps will cause peak electricity demand to double by 2050. Reliable flexibility can help negate the expensive infrastructural upgrades that will be required by reducing this peak, passing savings down to consumers.
Our intervention
Our intervention aimed to reduce electrical demand from heating during peak times. We achieved this by conducting events with willing OVO customers, preheating their homes prior to peak times, thereby shifting demand and minimising impact on the internal temperatures of homes and the thermal comfort of inhabitants. In January, the preheating period was two hours long, beginning at 2pm and ending at 4pm. In February, we increased the duration of the preheating period to four hours, starting at 12pm and ending at 4pm. During the preheating period, we added a schedule that was +1°C above the participants' setpoint temperature. The peak period remained three hours in duration across the trial, starting at 4pm and ending at 7pm. During the peak period, we added a schedule that was -1°C from the participants' setpoint temperature at the beginning of the intervention period. At the end of the peak period, the control of the heat pump was returned to the participants. Our intervention only controlled setpoint temperatures, and we only monitored electrical consumption resulting from space heating. To ensure participants' homes remained at healthy temperatures, we had a minimum setpoint temperature of 18 °C during peak periods.
The intervention was orchestrated through the Kaluza platform, which aggregated real-time data and enabled the remote scheduling of setpoint changes across participating households. While those who took part in the intervention were aware that their heating was being altered, they were not informed about the specific changes that would be made to their heating schedules or the specific time bracket the intervention would take place. We did not provide this information so that we could assess whether participants thought they had noticed any changes resulting from our intervention.
We initiated events on 6 January 2025, with our final event being on 1 April 2025. We ran events every Monday to Friday across 12 weeks, with our intervention applied across 61 days in total. We avoided weekends as we wanted to test our intervention against the conventional peak demand period in the working week.
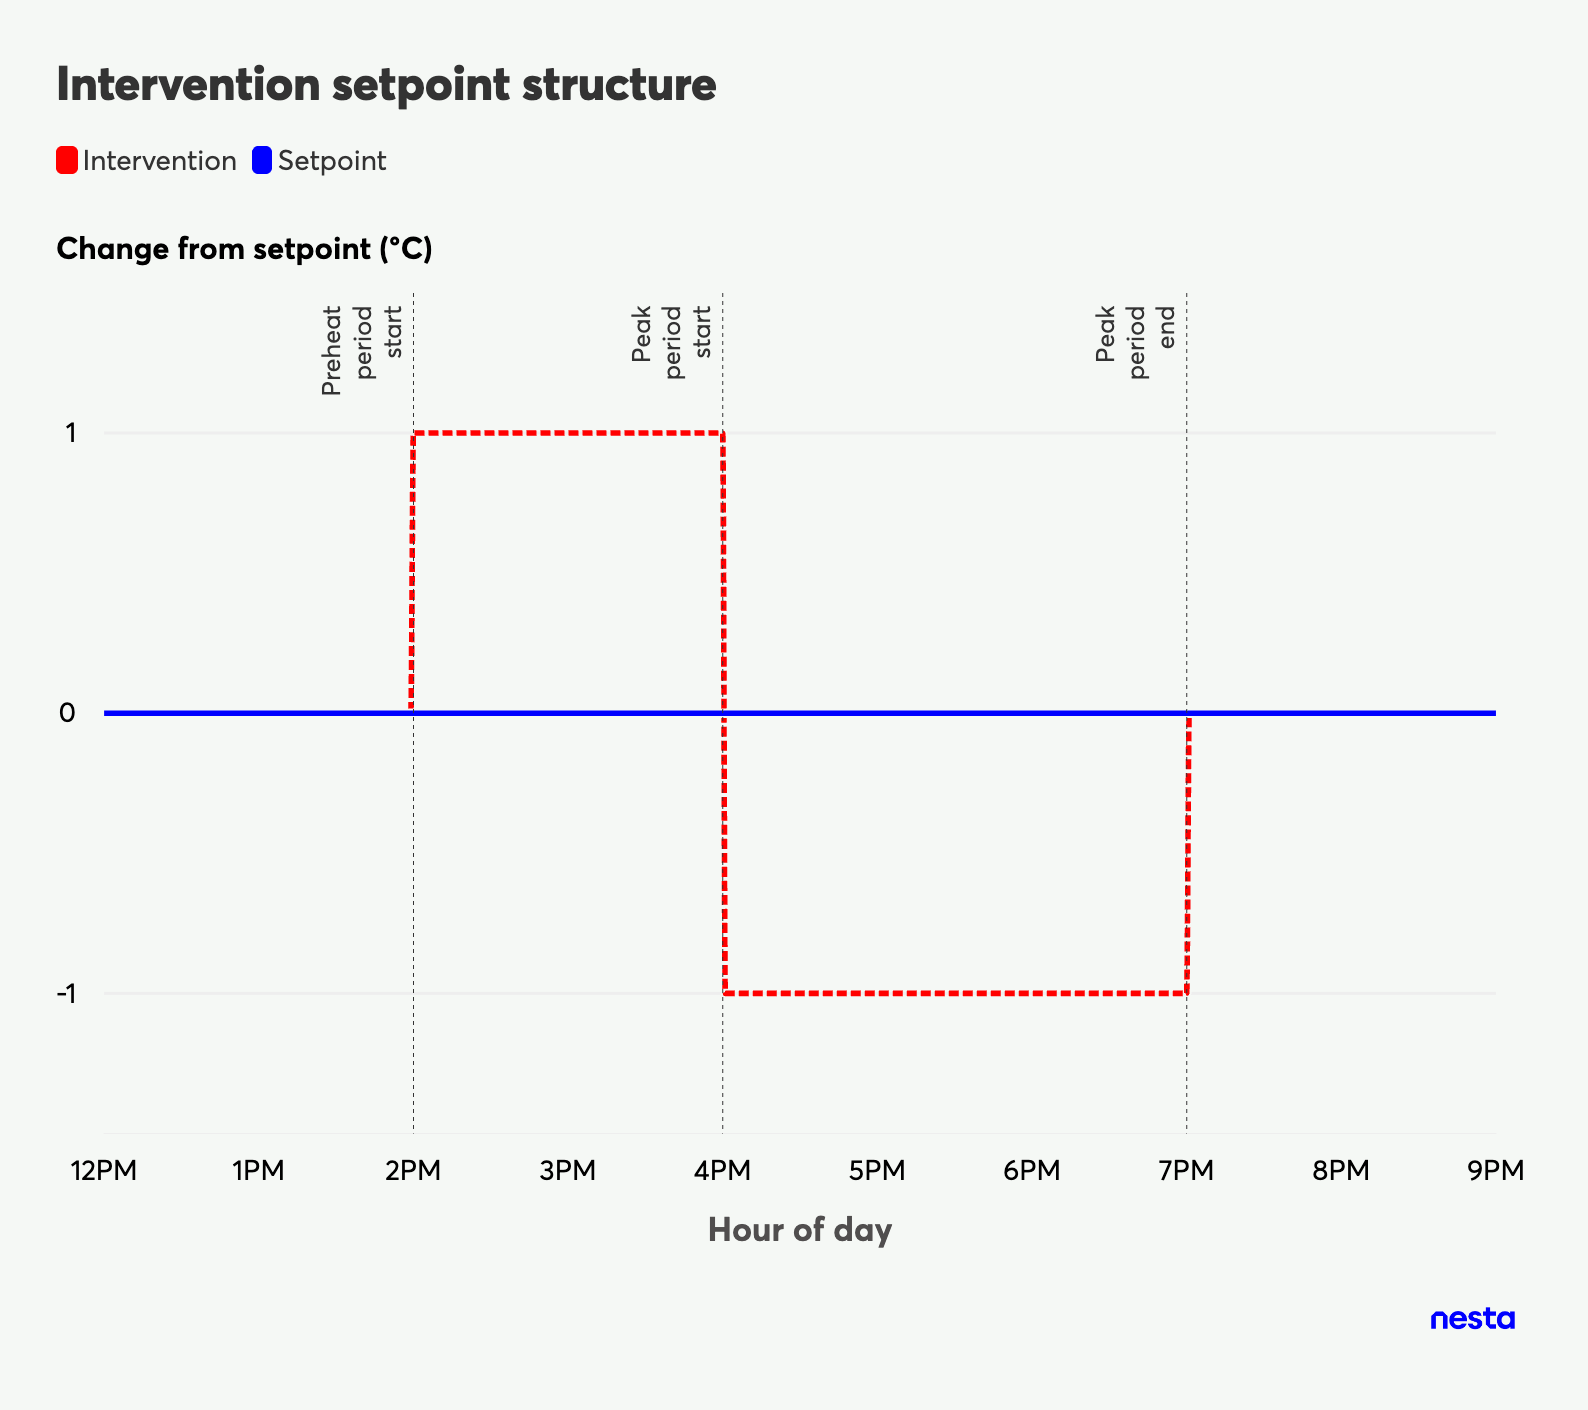
Figure 1: Illustration of each heating event in January. In February and March, the intervention period started at 12pm rather than 2pm.
2. Research aims and methodology
Research aims
This project aimed to test how automated flexibility could be incorporated into a type-of-use tariff, Heat Pump Plus. The successful integration of automated flexibility is considered a key component in optimising heat pump owners' running costs, ensuring that energy suppliers like OVO are able to continue providing low unit rate tariff offerings. To assess the viability of automated flexibility in type-of-use tariffs, we sought to explore the following thematic areas.
- Load shifting and value to consumers. Our primary objective was to reduce electrical consumption during peak periods. We implemented optimised timings and measured heat pump electrical consumption, hypothesising that we could shift demand using preheating whilst not impacting overall consumption each day.
- Customer comfort perception. We also assessed whether participants found their homes comfortable and whether they had noticed any negative impacts as a result of our intervention. To learn more about their thermal comfort, we conducted weekly surveys with all households, two rounds of AI interviews, plus six human-led interviews. We recorded whether they had boosted their heating during the course of the intervention. Our hypothesis was that the temperature changes introduced by our intervention would not be detectable for many, and satisfactory for most, resulting in a low to no need for people to boost their heating.
- Impact on COP. We recorded whether our optimised heating timings would impact the COP of participants' heat pumps. The COP was calculated and recorded by each heat pump, with our hypothesis being that we would observe a slight decrease.
- Willingness for households to hand over control. We explored whether the introduction of automation to the Heat Pump Plus tariff would be acceptable to participants. We did this by interviewing people throughout the trial. Our hypothesis was that automation would be an acceptable addition to the tariff for most participants.
Research design
We recruited 58 OVO customers using the Heat Pump Plus tariff to take part in our trial
An invitation was sent out to OVO's Heat Pump Plus tariff users across the UK. All invitees were offered a £100 gift card voucher as a thank you for taking part in the trial and needed to have a Vaillant AroTherm Plus heat pump with a myVaillant connect to take part. We initially recruited 61 participants; however, two participants did not complete the onboarding survey and one participant dropped out of the trial in January. This left us with a total of 58 participants in our treatment group.
We used a quasi-experimental design to estimate the impact of our intervention on households' heat pump consumption
To explore whether we were able to shift heat pump electricity demand effectively, we used a quasi-experimental approach known as matching. This involved creating a comparison group of other OVO customers that used OVO's Heat Pump Plus tariff (approximately 320 households), enabling us to compare those who took part in events and the comparison group to assess the impact of the events. The comparison group comprised users who were eligible to participate in our trial, but did not wish to take part or were unable to be invited. Further information on this approach can be found in the Appendix. There are some key limitations to this approach, notably that households that decided to take part might differ from those who chose not to, which we discuss in the Limitations section.
We utilised a mixed-methods approach to answer our research questions
Data was collected via a number of sources, with consent from the households taking part in the intervention:
- We collected heat pump electrical consumption resulting from space heating at 60-minute intervals. We were able to calculate the daily COP of each heat pump from the measured electrical consumption and output thermal energy. The use of the temperature boost function was recorded during preheating and peak periods. These were collected directly from the heat pump via the myVaillant connect internet gateway.
- We collected internal temperatures via each household's smart thermostat.
- Each participant was required to complete an onboarding survey at the beginning of the trial to provide details about their household.
- We conducted weekly surveys administered by email to capture participants' experiences and activities. We delivered our surveys at the end of Wednesday each week so that they did not align with our intervention timings.
- We invited all participants to complete two rounds of interviews across WhatsApp using Langwith Research's AI interviewer. We also conducted six human-led semi-structured interviews between the two rounds of AI interviews.
3. Key findings
In this section, we detail the key findings from our research. We have separated this into three sections: 1) Load shifting, 2) Participant experience, and 3) Limitations. To provide context to these findings, we first describe the characteristics of our trial participants.
Sample description
All participants invited to join the trial had to meet the following criteria:
- OVO customer
- On Heat Pump Plus tariff add-on
- Had a Vaillant AroTherm Plus heat pump
- Had a myVaillant connect internet gateway
Participants meeting these criteria did not require any hardware installation to take part in the trial. We fully onboarded 59 participants to start the trial, with one participant dropping out in January 2025, resulting in a total of 58 participants. Our sample contained a relatively high prevalence of solar PV (33%, n=19) when compared to the wider UK population (5-6%). Although high compared to the general population, it is lower than the 45% observed in Nesta's survey of 2,500 heat pump owners in 2022, and much lower than the 77% observed in the HeatFlex trial in 2024. In-home batteries were also less common (10%, n=6) than amongst participants when compared to the 47% observed in Nesta's HeatFlex trial, although their prevalence was similar to the 14% observed in Nesta's survey of 2,500 heat pump owners. This suggests that our sample might consist of early adopters, reducing the generalisability of our results to a future, larger population of heat pump owners.
We also noted that people had high levels of satisfaction with their heat pump when entering the trial, with 91% (n=53) of survey respondents stating that they had been satisfied with the internal temperatures of their homes in the week prior to starting the trial. In our intake survey, we also asked participants how they would rate the overall comfort of their homes on a scale of one to five, with one being "very uncomfortable” and five being “very comfortable”. The majority of participants reported having a comfortable home, with 83% (n=48) responding that they were either comfortable or very comfortable.
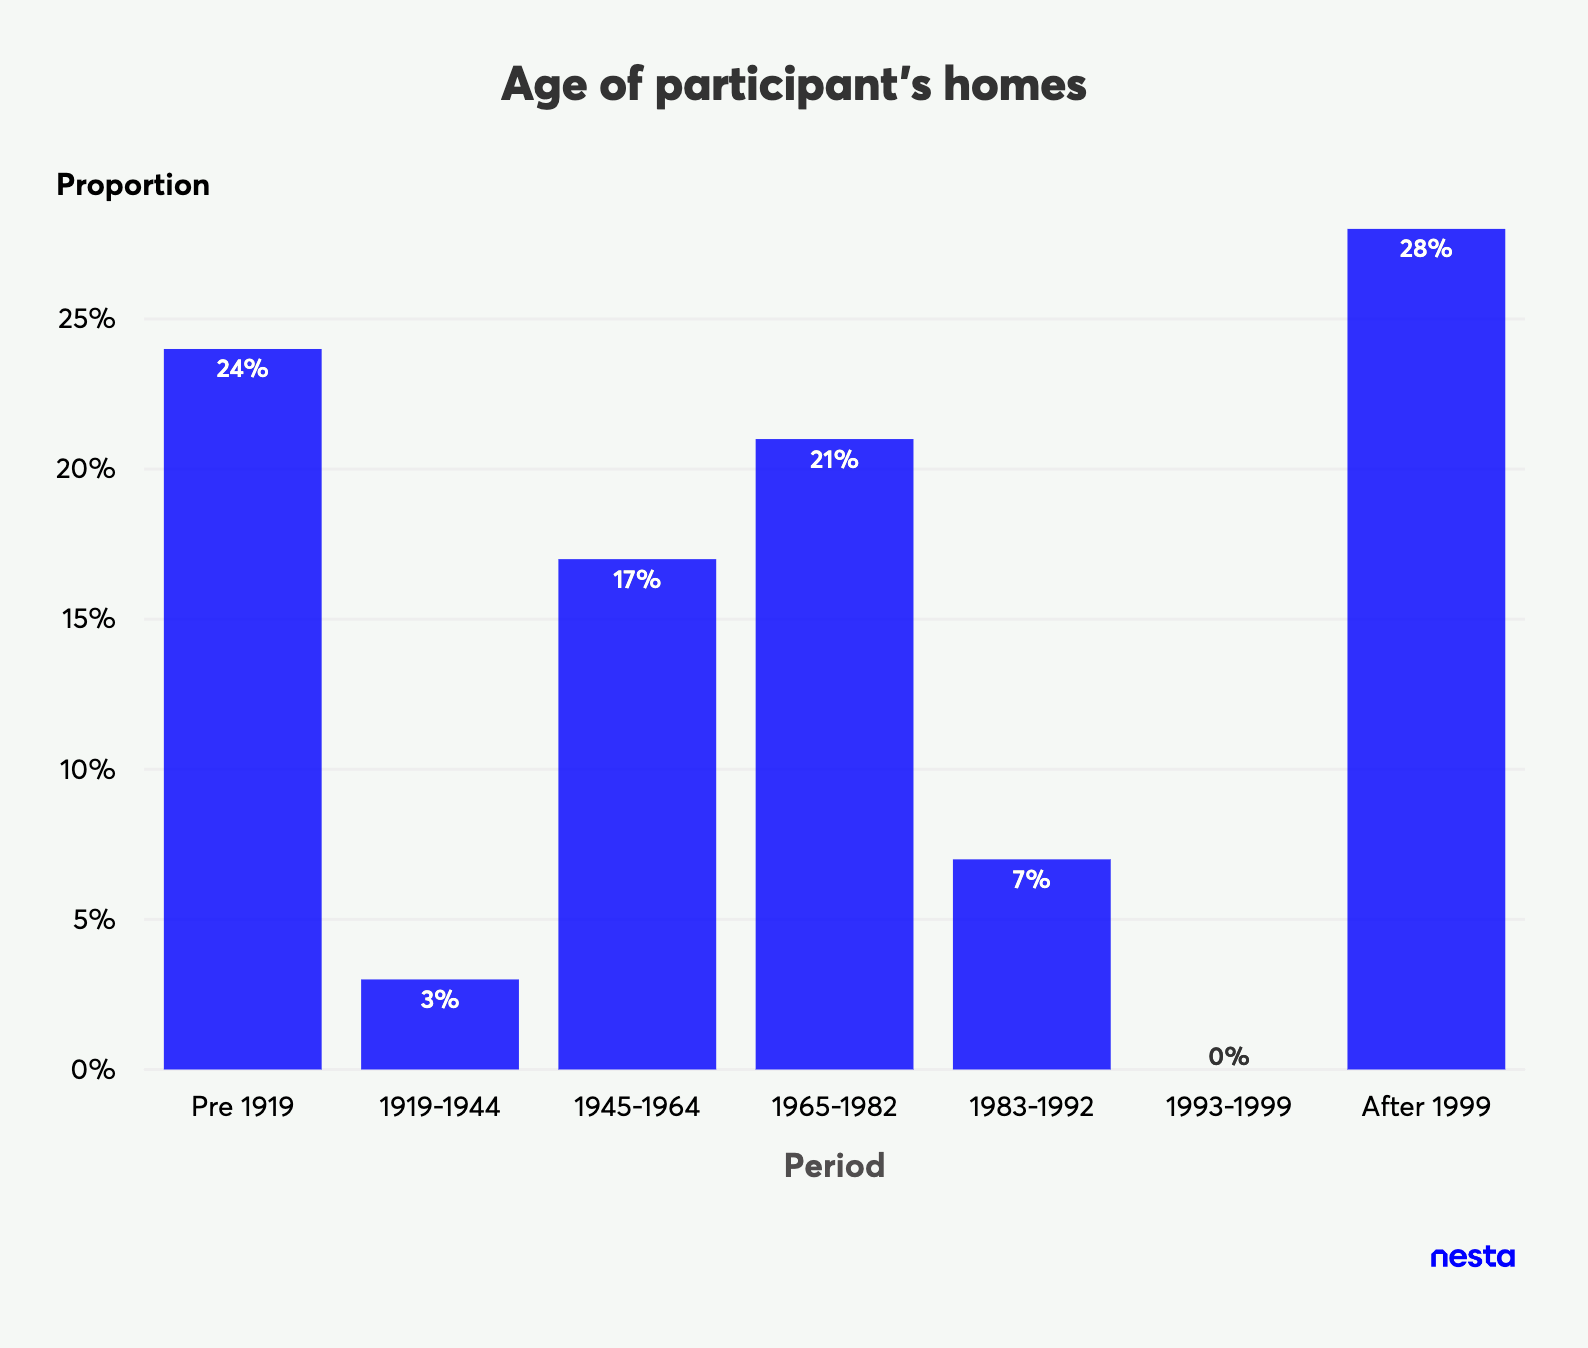
Figure 2: Descriptive statistics on the Age of participants' homes (n=58).
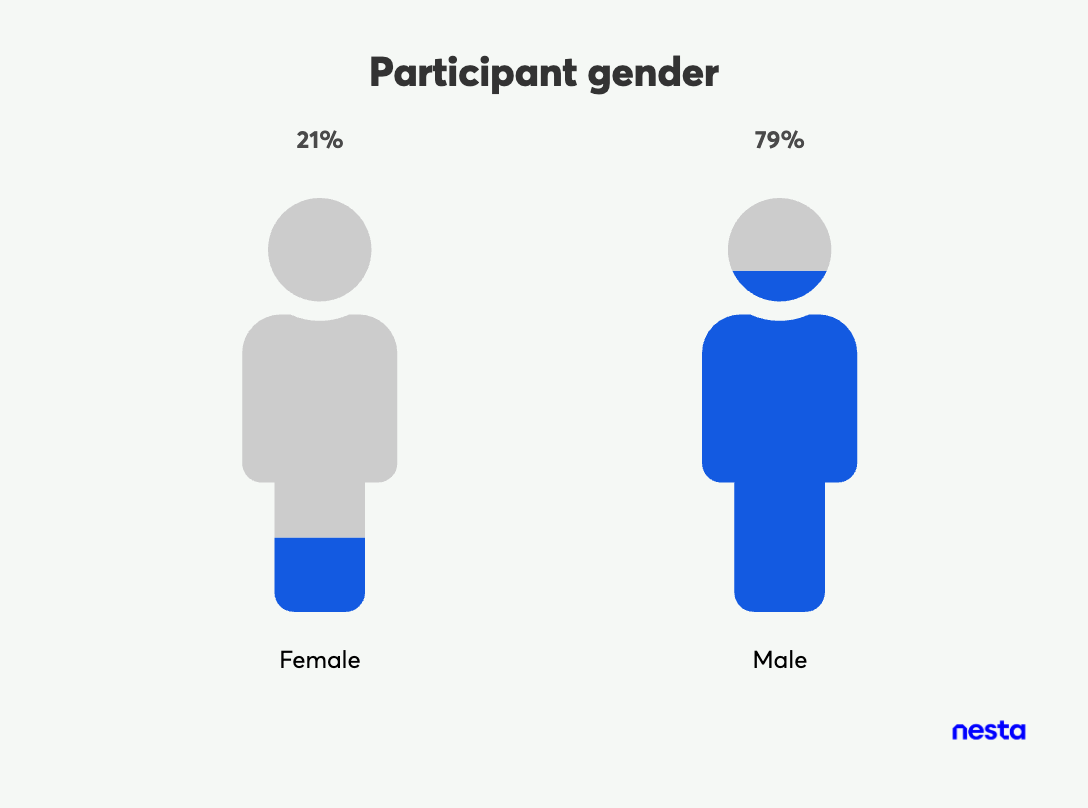
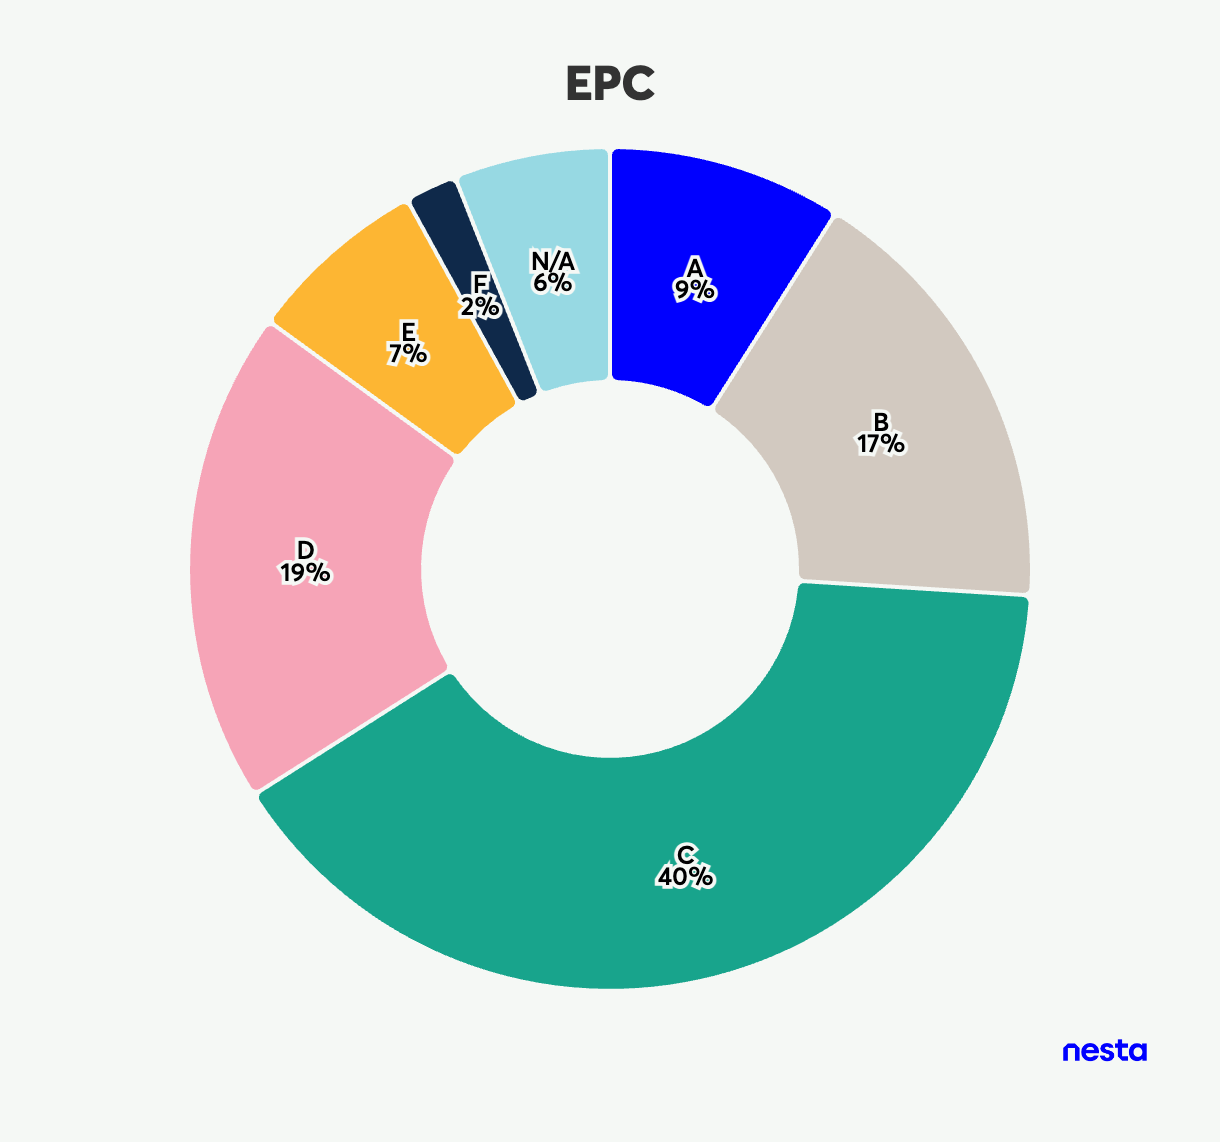
Figure 3: Descriptive statistics on account holder gender and property EPC rating (n=58).
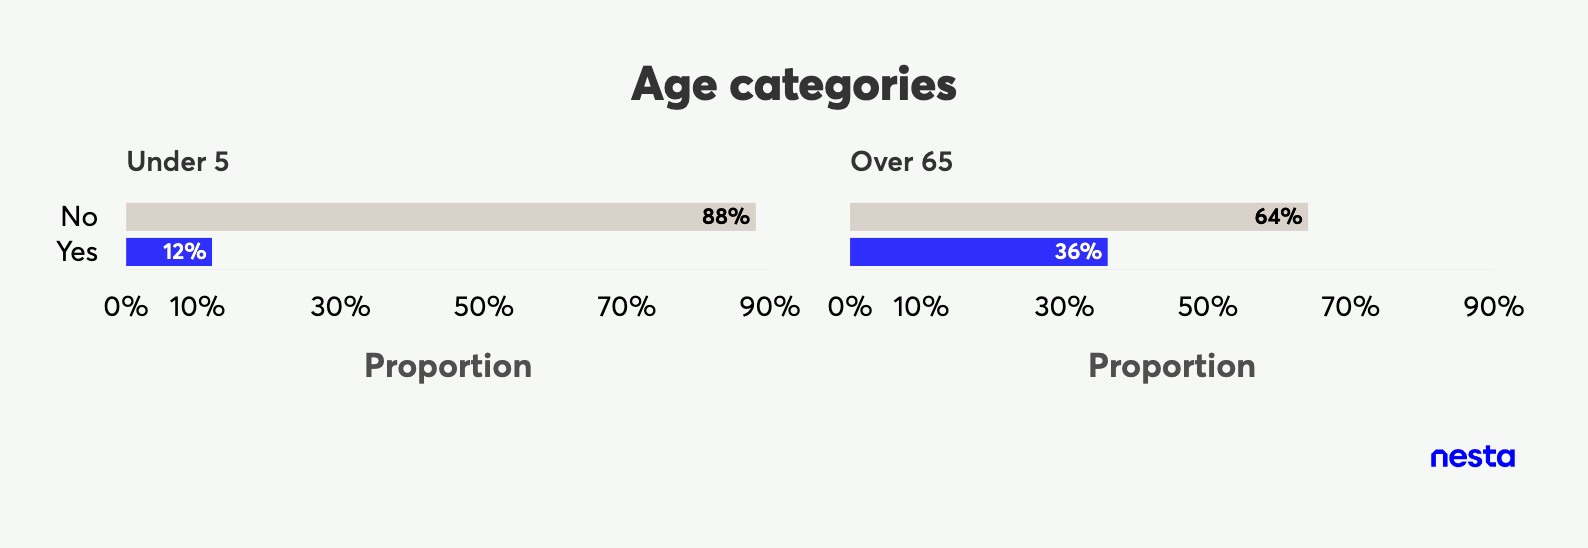
Figure 4: Descriptive statistics on participants' age categories (n=58).
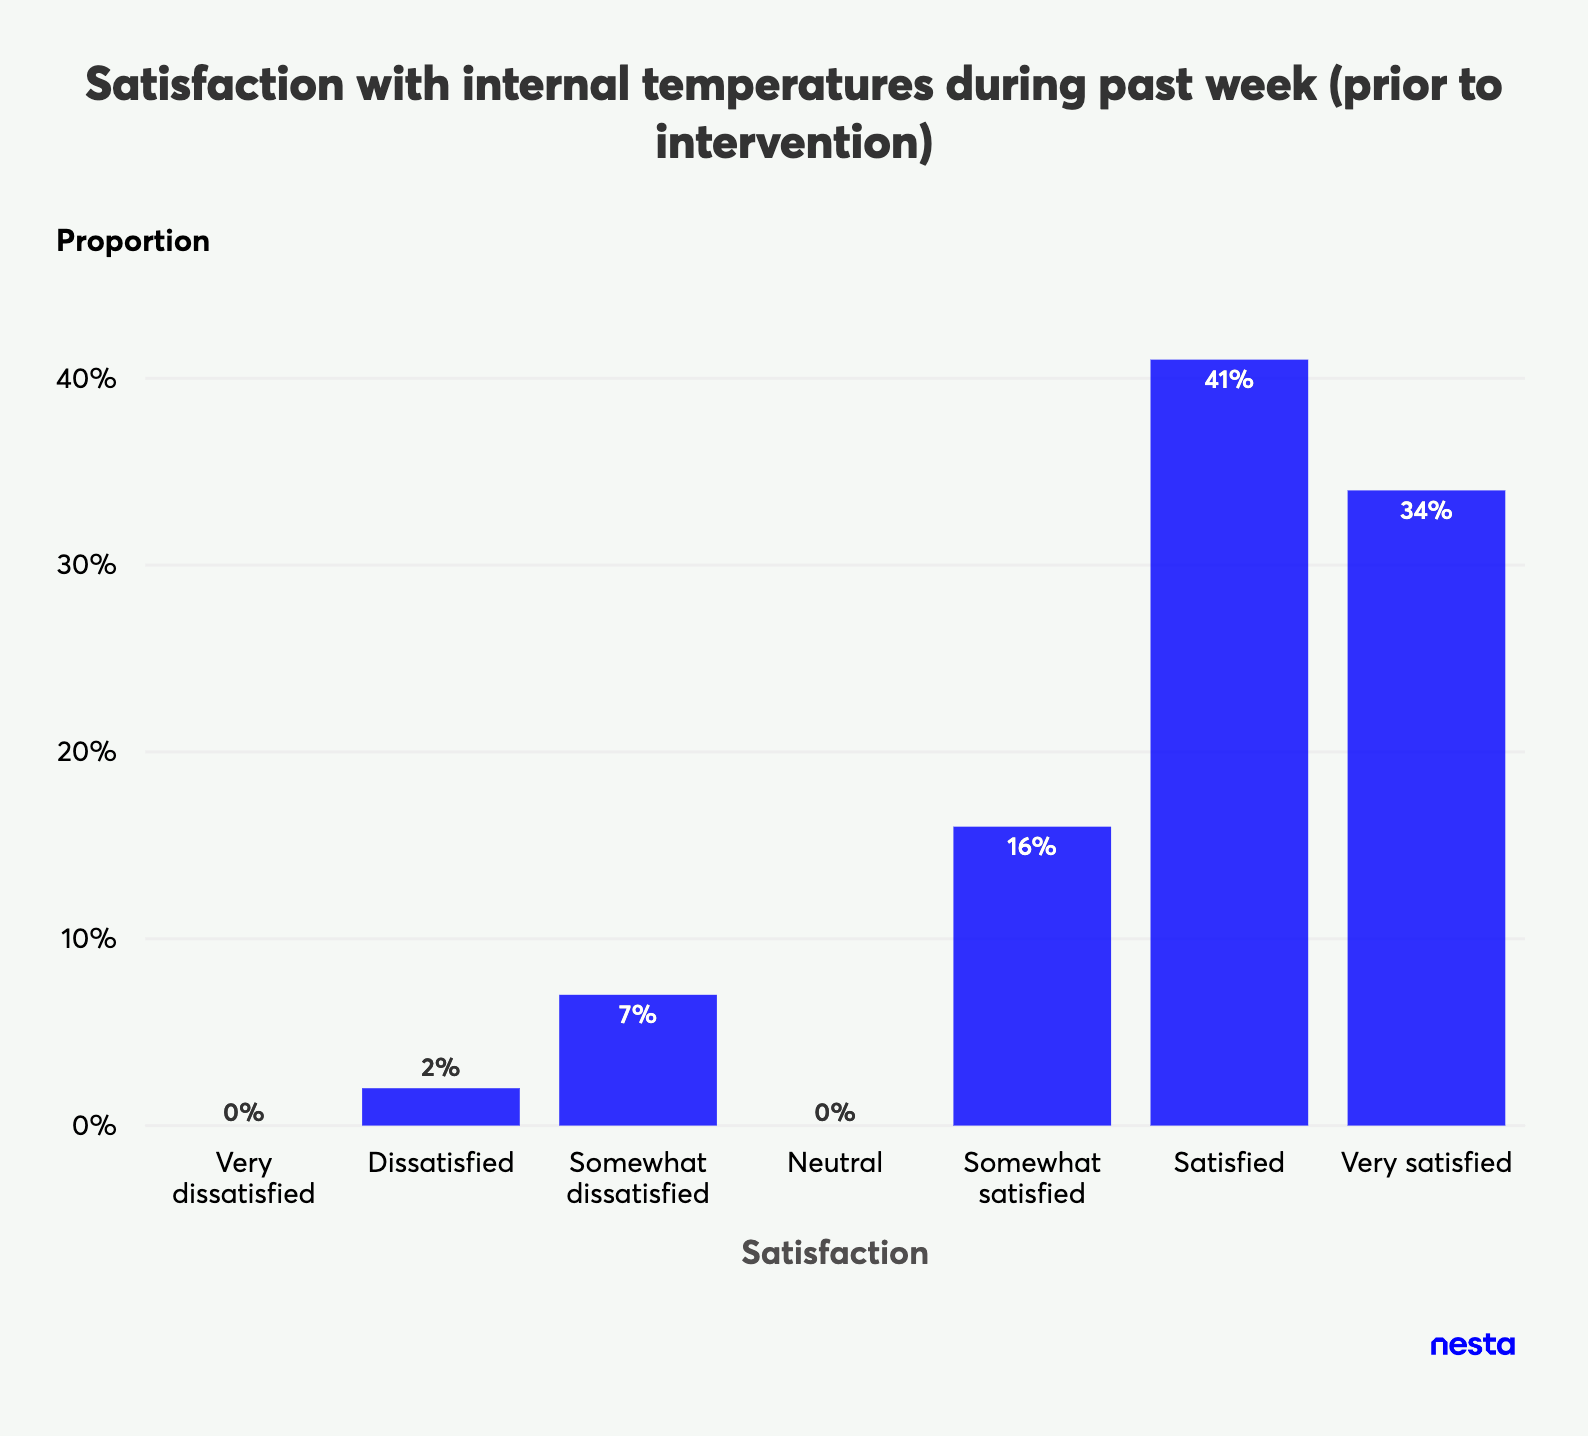
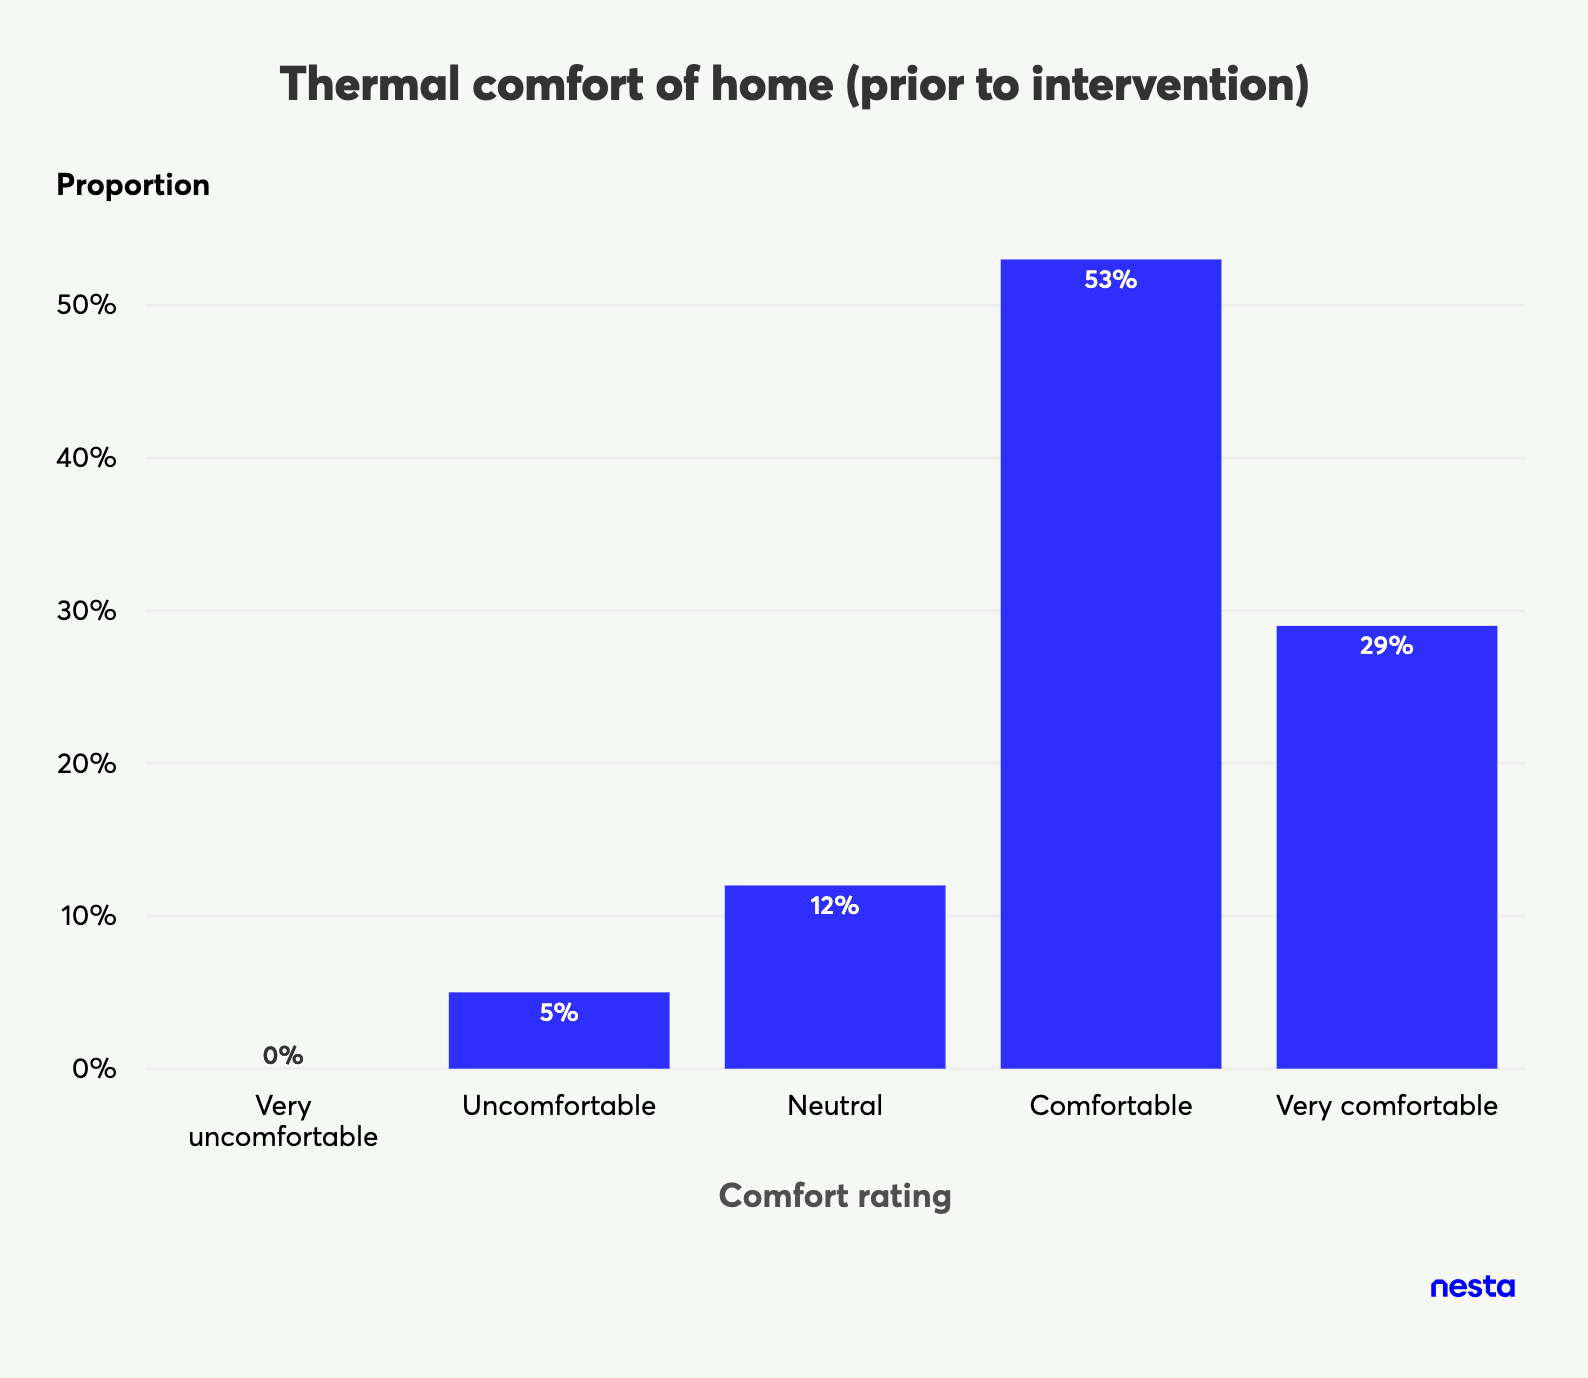
Figure 5: Survey results of participant thermal comfort and satisfaction prior to taking part in the trial (n=58).
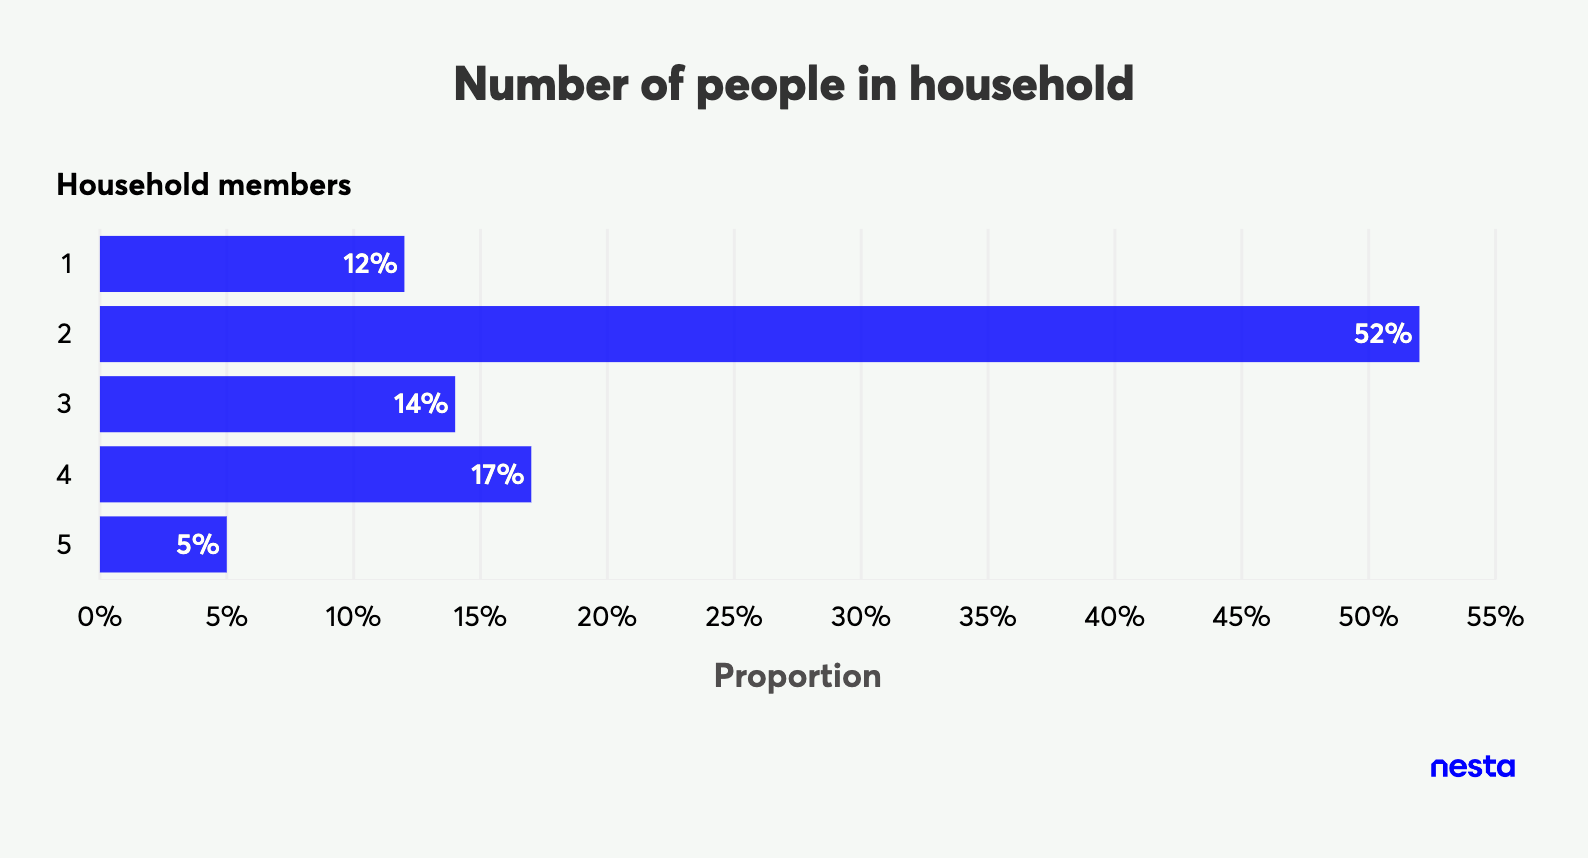
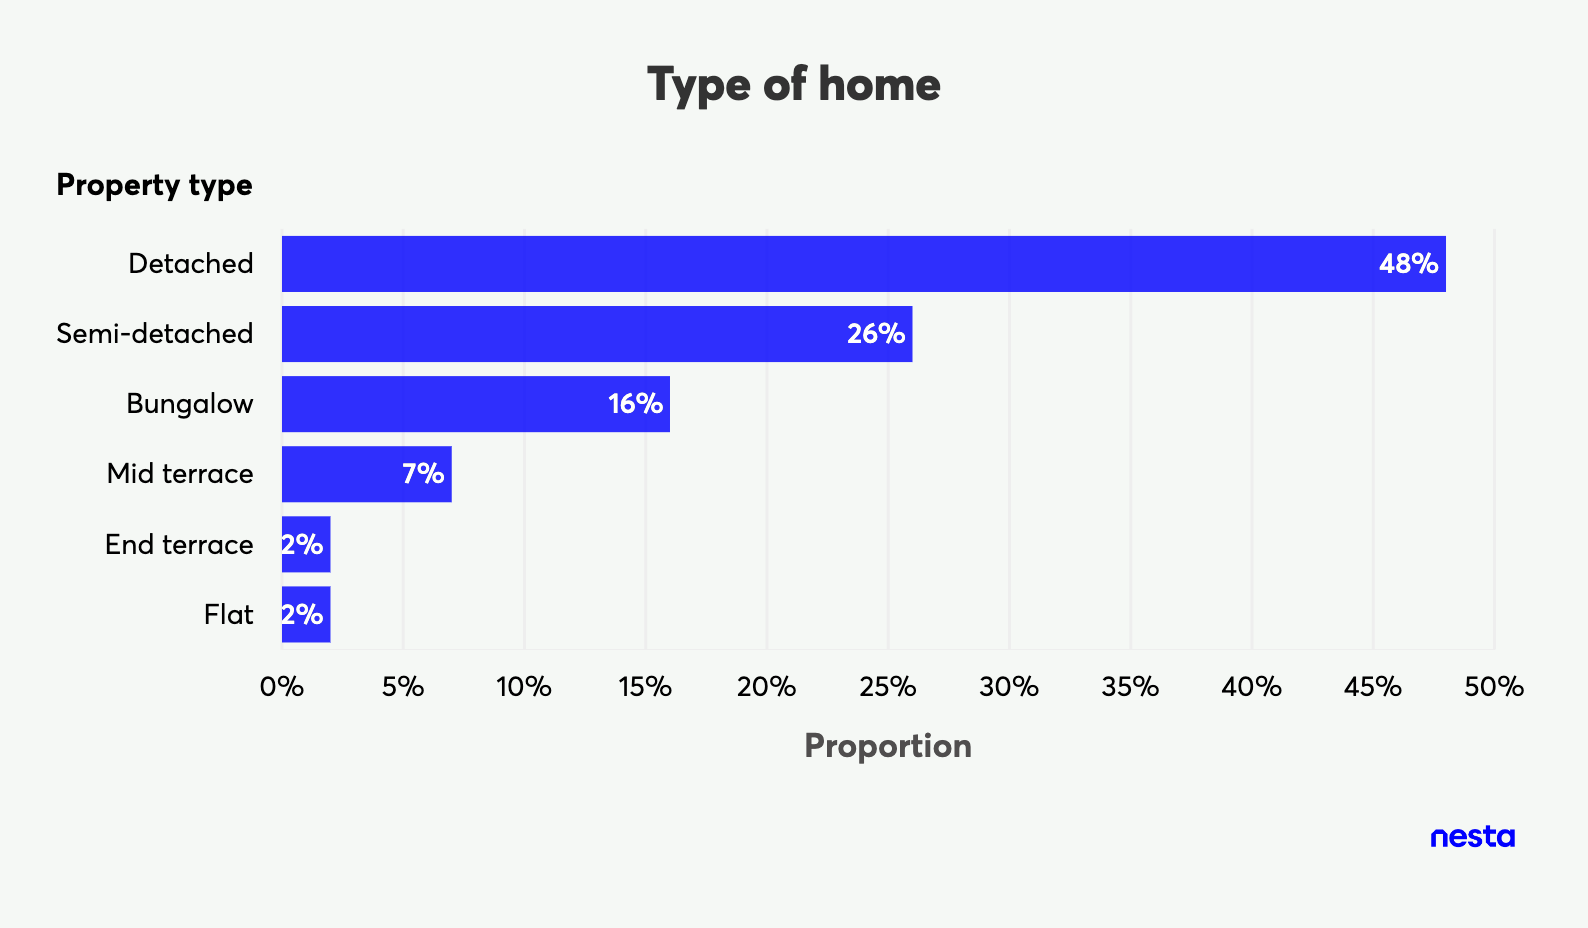
Figure 6: Descriptive statistics of household occupants and property type (n=58).
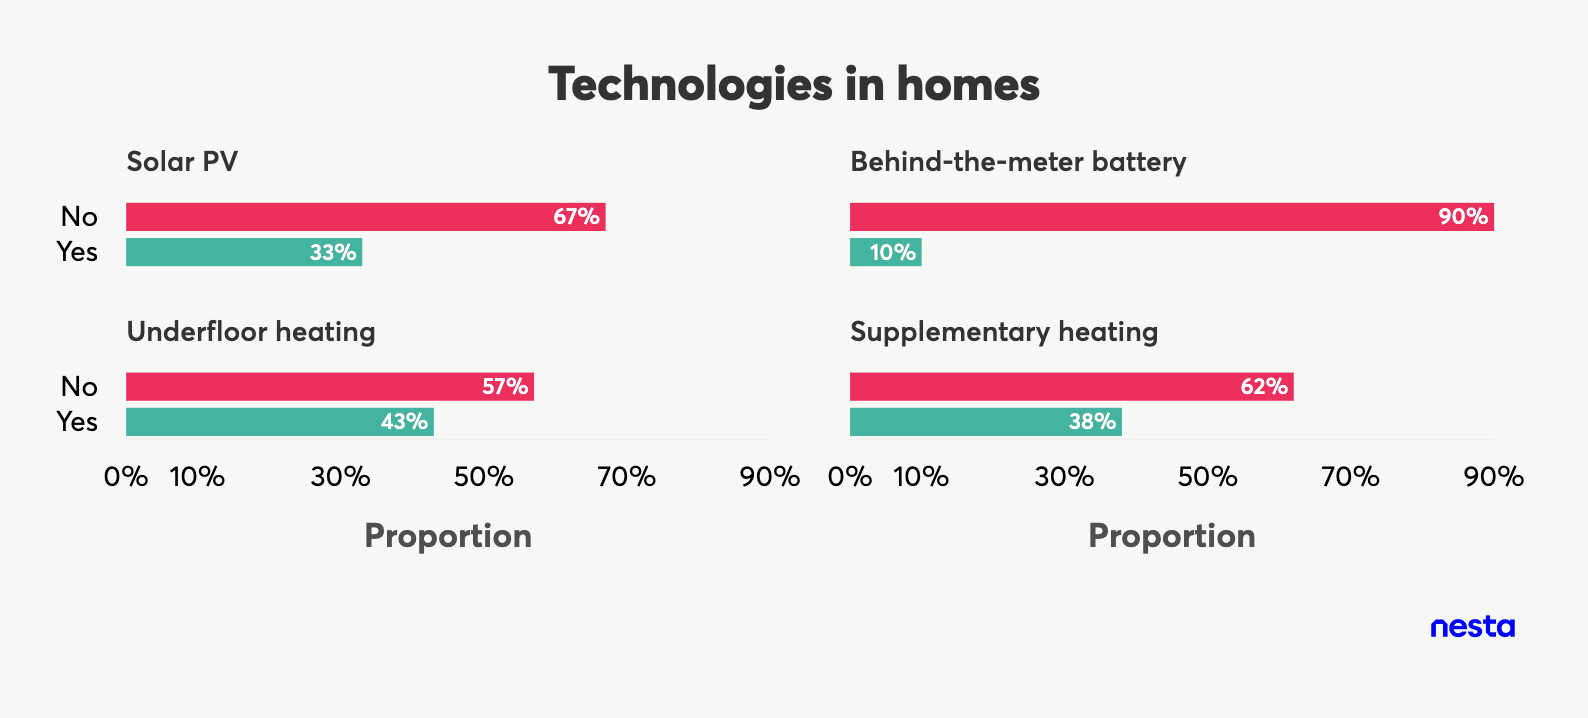
Figure 7: Descriptive statistics for types of technologies in participants' homes (n=58.)
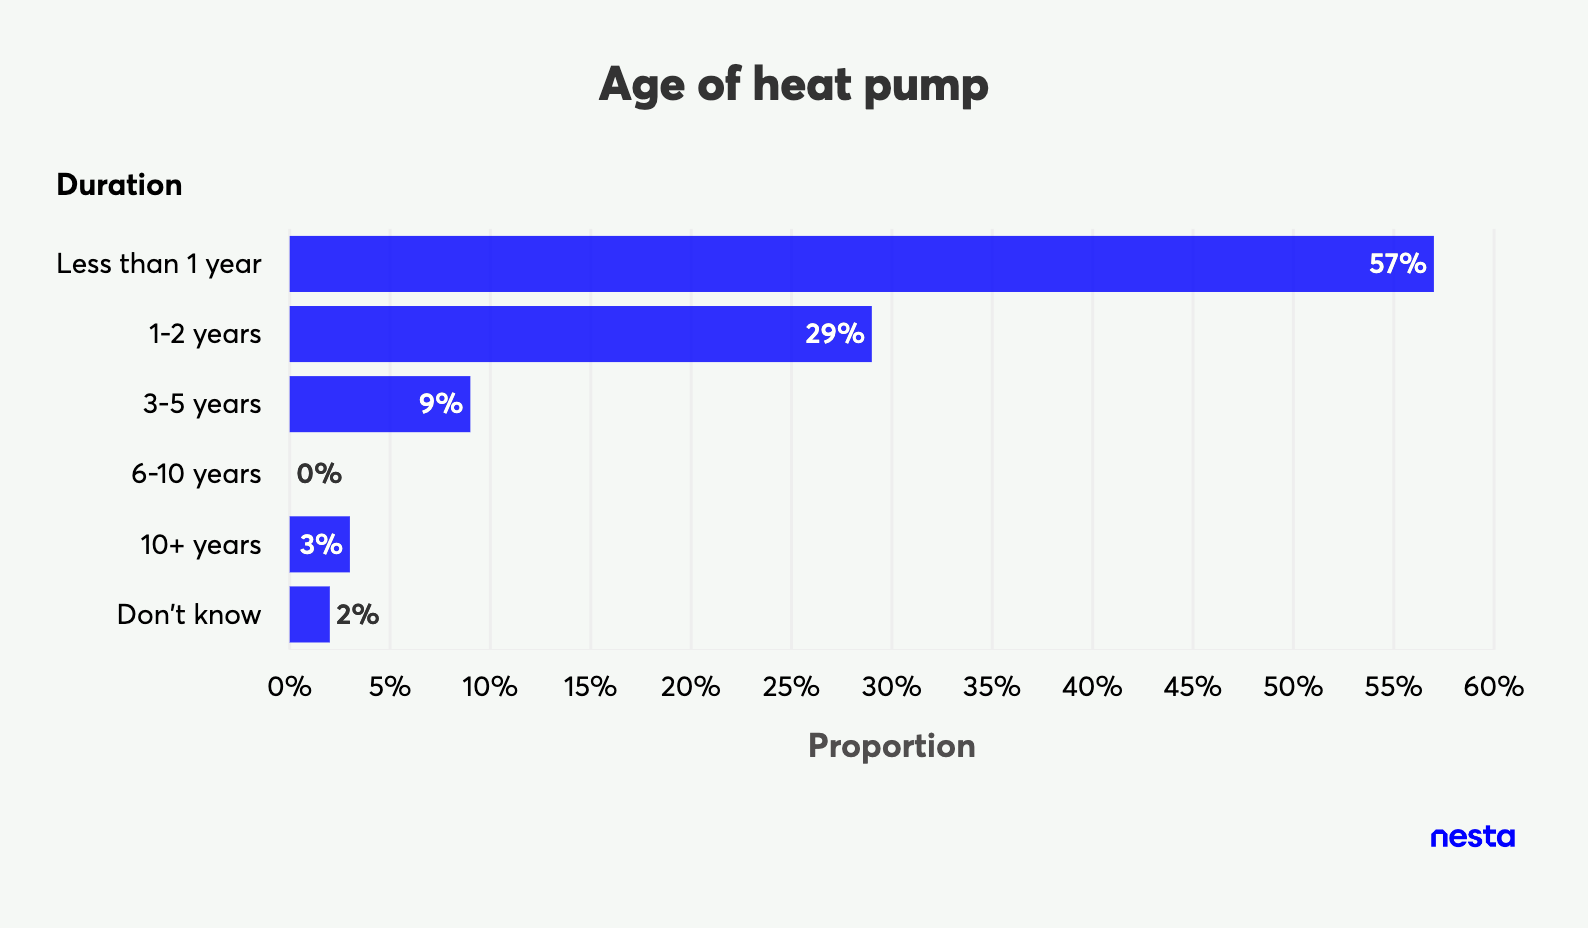
Figure 8: Descriptive statistics for the age of participants' heat pumps (n=58).
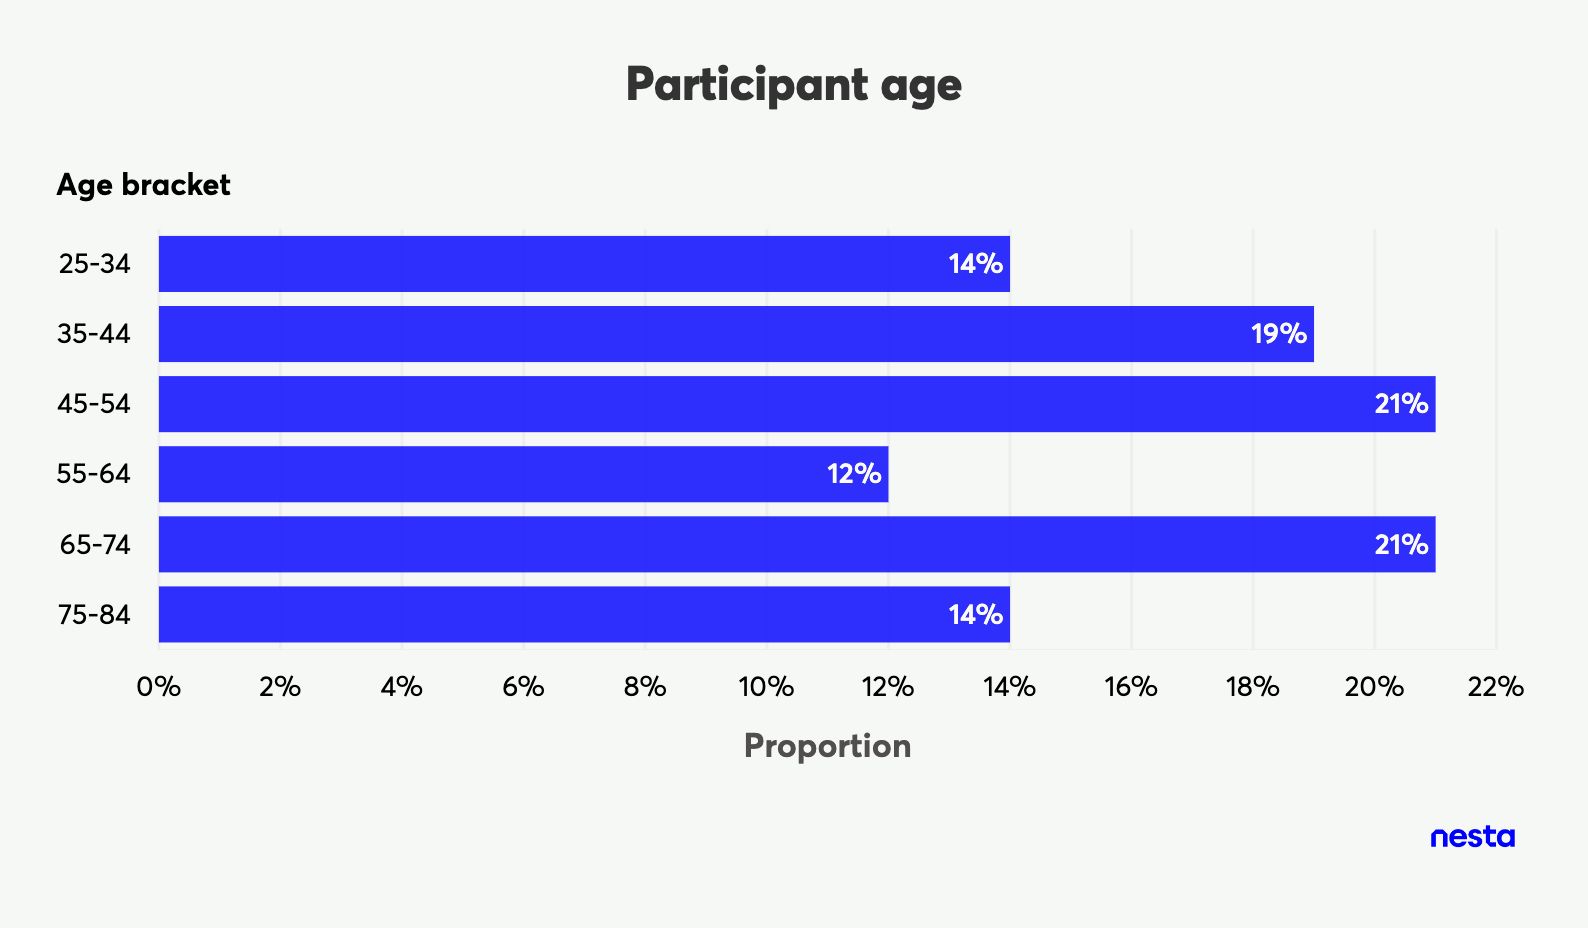
Figure 9: Descriptive statistics for the age of the participant completing the onboarding survey (n=58)
Load shifting
This section details our quantitative research investigating the impact our intervention had on the electrical consumption of our participants' heat pumps. These results focus on the electrical consumption of participants' heat pumps used for space heating, and do not include any consumption related to domestic hot water. A smaller sample, 43 participants, was used for the quantitative analysis due to a number of devices failing to connect via the API or not being integrated into the energy management platform used.
We successfully increased participants' internal temperatures in our preheat period and decreased them in the peak period
We increased participants' setpoint temperature by +1°C in the preheat period and -1°C in the peak period. When looking at the average internal temperatures of participants' houses, we see the expected change in internal temperatures in response to our intervention. In January, the treatment group experienced an average increase of 0.29°C in the preheat period and an average decrease of 0.24°C in the peak period. In February/March, the treatment group experienced an average increase of 0.70°C in the preheat period and an average decrease of 0.48°C in the peak period. The greater increase in temperatures during February could be due to the extension of the preheat period from two to four hours, or other factors like slightly warmer exterior temperatures.
By calculating the average internal temperature for each participant, we can assess whether our intervention was having the intended effect. In cases where our intervention was successfully applied, we would expect an increase in temperature during the preheat period, followed by a decrease in temperature over the peak period. There was a large variation in internal temperature change observed across the households, with some thermal profiles not fitting the expected pattern. We observed three other patterns that we classified as “constant heating”, “constant cooling”, or “other”. We do not believe that there was a singular reason for these unexpected internal temperature profiles. Some potential causes could include additional heating zones not being controlled, participants editing our schedules, low overnight setpoints, setpoint temperatures below 18°C or thermostats being in unusual positions.
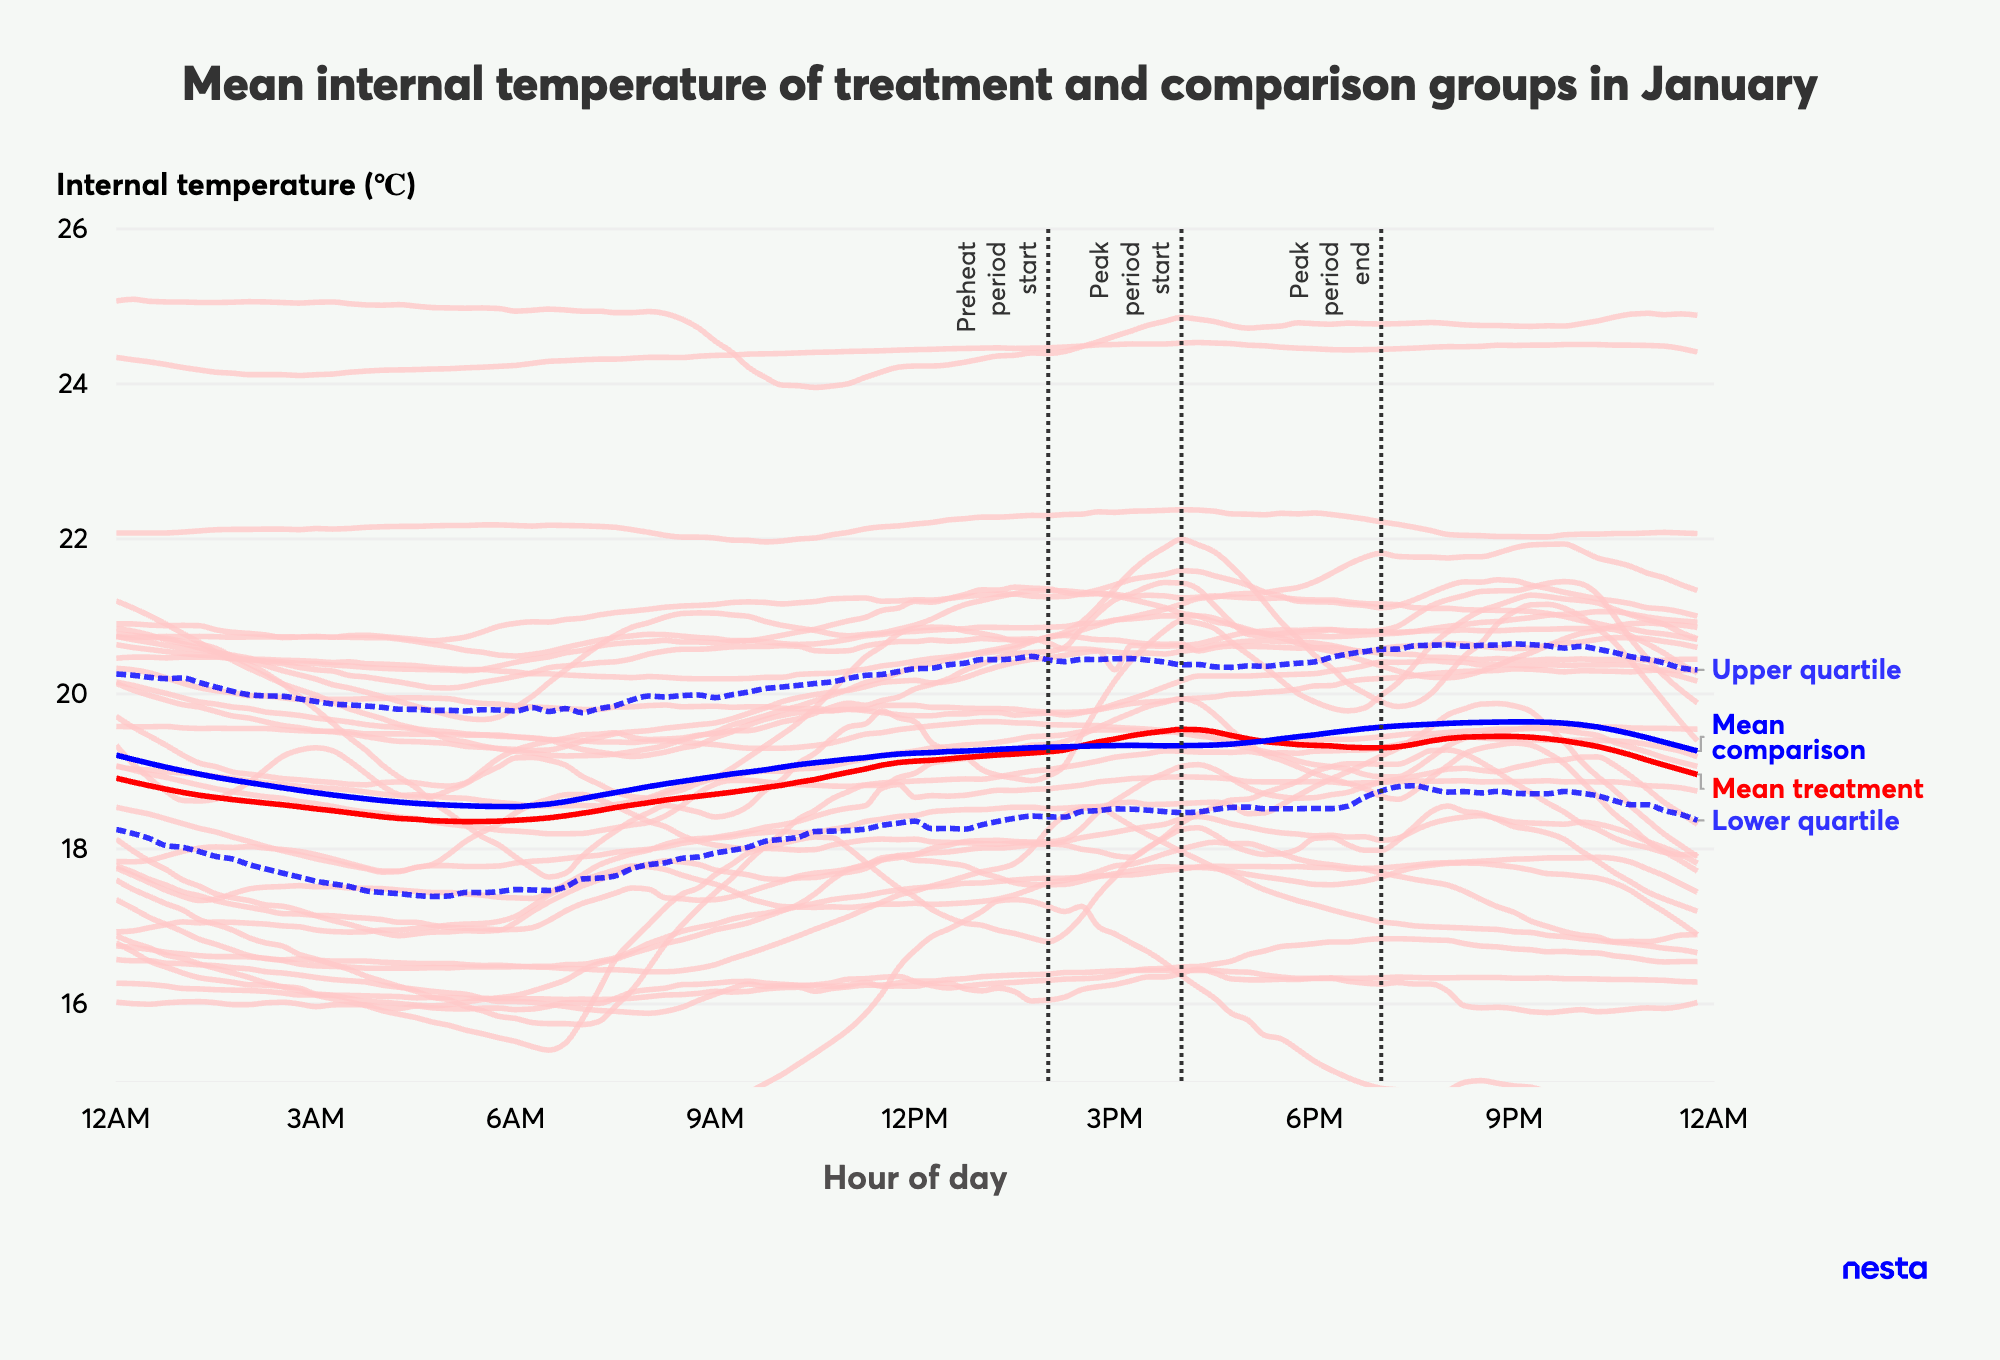
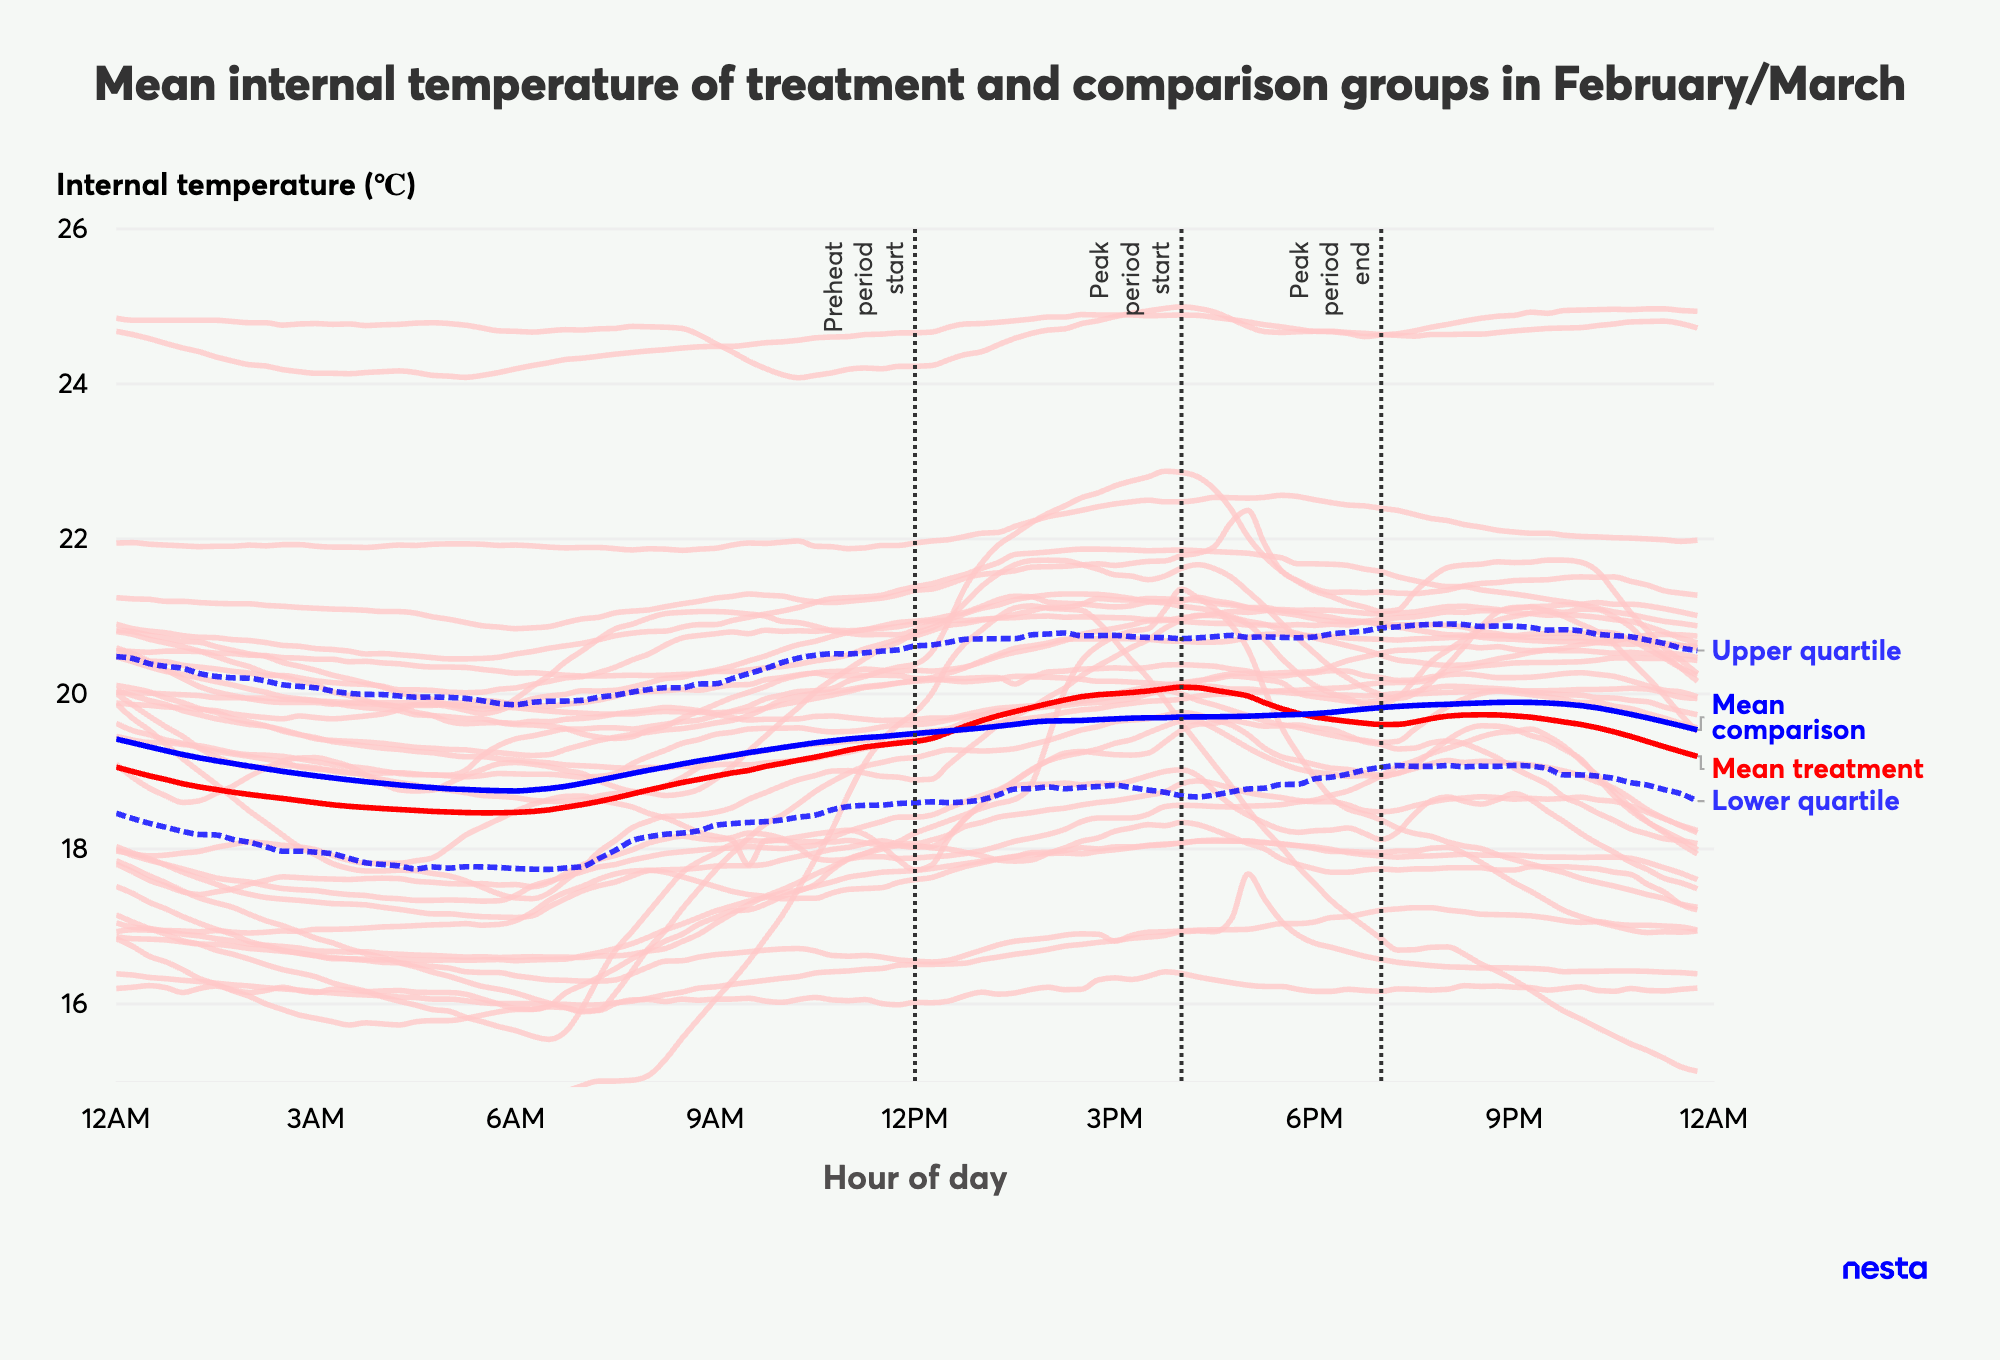
Figures 10 and 11: Mean internal temperature changes of the treatment and comparison groups' homes across a 24-hour period in January and February/March. The upper and lower quartiles of the comparison group are shown as blue dashed lines. The mean internal temperature of each individual participant in the treatment group is also shown. Data from weekends, heat pumps in holiday mode, and participants with multiple heating zones have been removed.
We estimated that taking part in events resulted in a ~30% reduction in heating consumption between 4pm-7pm
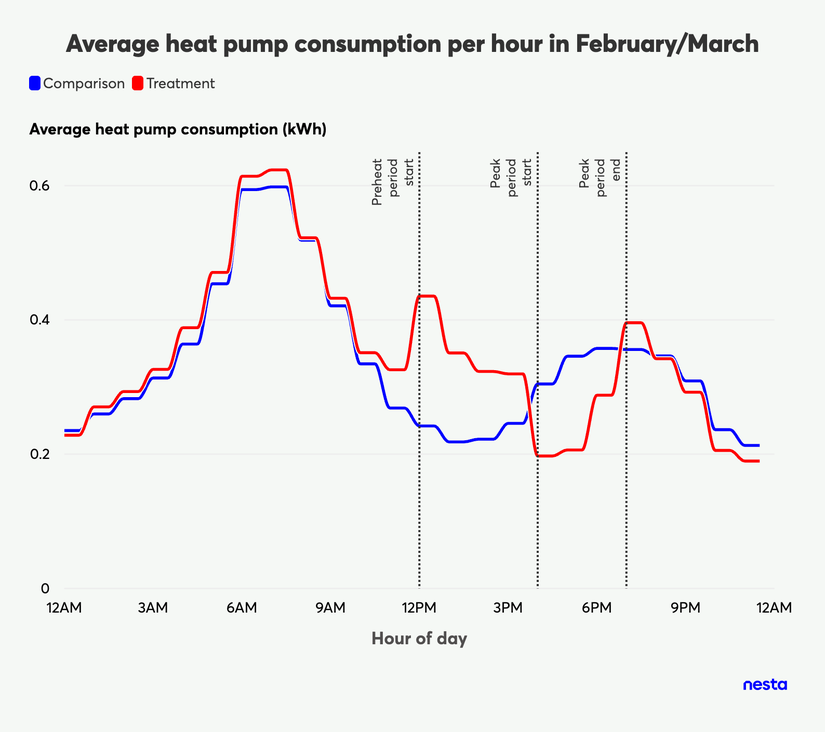
Daily load profiles of the treatment and comparison groups were compared using multivariate regression analysis to determine whether there was a difference in heat pump consumption during a three-hour peak period (4pm-7pm) between those who took part in events and the comparison group. We estimated that participants who took part in events had a 0.73 kWh lower heat pump consumption during the peak period compared to the comparison group (p = .001, 95% Confidence Intervals: -1.17; -0.29) for the shorter period in January. In February/March, we estimated that participants who took part in events had a 0.76 kWh lower heat pump consumption during the peak period compared to the comparison group (p < .001, 95% Confidence Intervals: -1.09; -0.43). These relate to a decrease in average of 26% of each heat pump's electrical demand away from the peak period in January, increasing to 36% in February/March.
The increase in load shifting in February/March may have been due to the extended preheating period. We theorised that properties may have stayed above the minimum setpoint temperature for a longer period, enabling increased avoidance of heating in the peak period. Other factors, such as increasing external temperatures or participants becoming used to the intervention, may also have contributed towards these observed changes.
We managed to shift a significant proportion of average space heating demand away from the peak period with only subtle changes in internal temperature. Despite being significant, the magnitude was lower than we expected when compared to similar examples of semi-direct load shifting. We think that the setpoint change of +-1°C may be too small to elicit the desired effect for some households. Increasing setpoint limits during the preheat and peak periods may increase the magnitude of load shift.
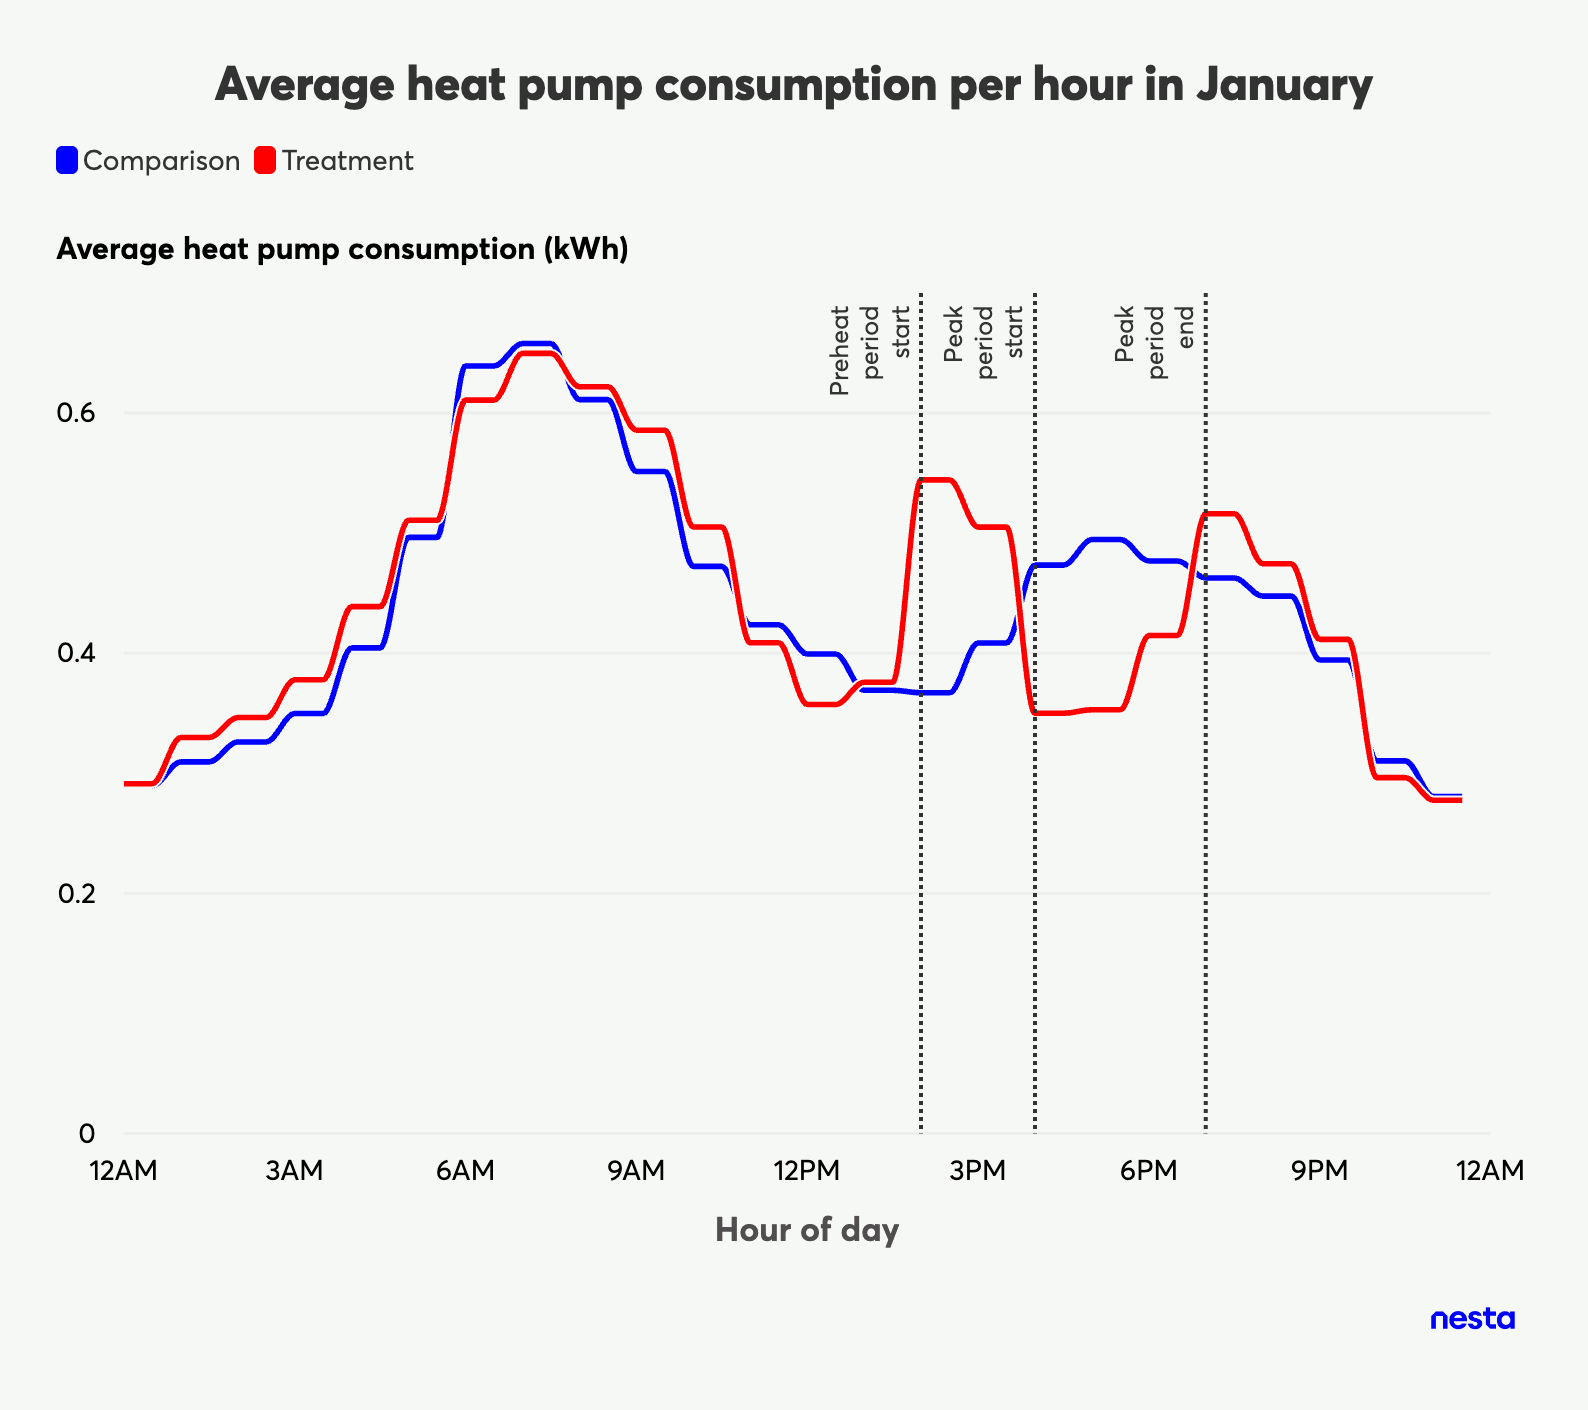
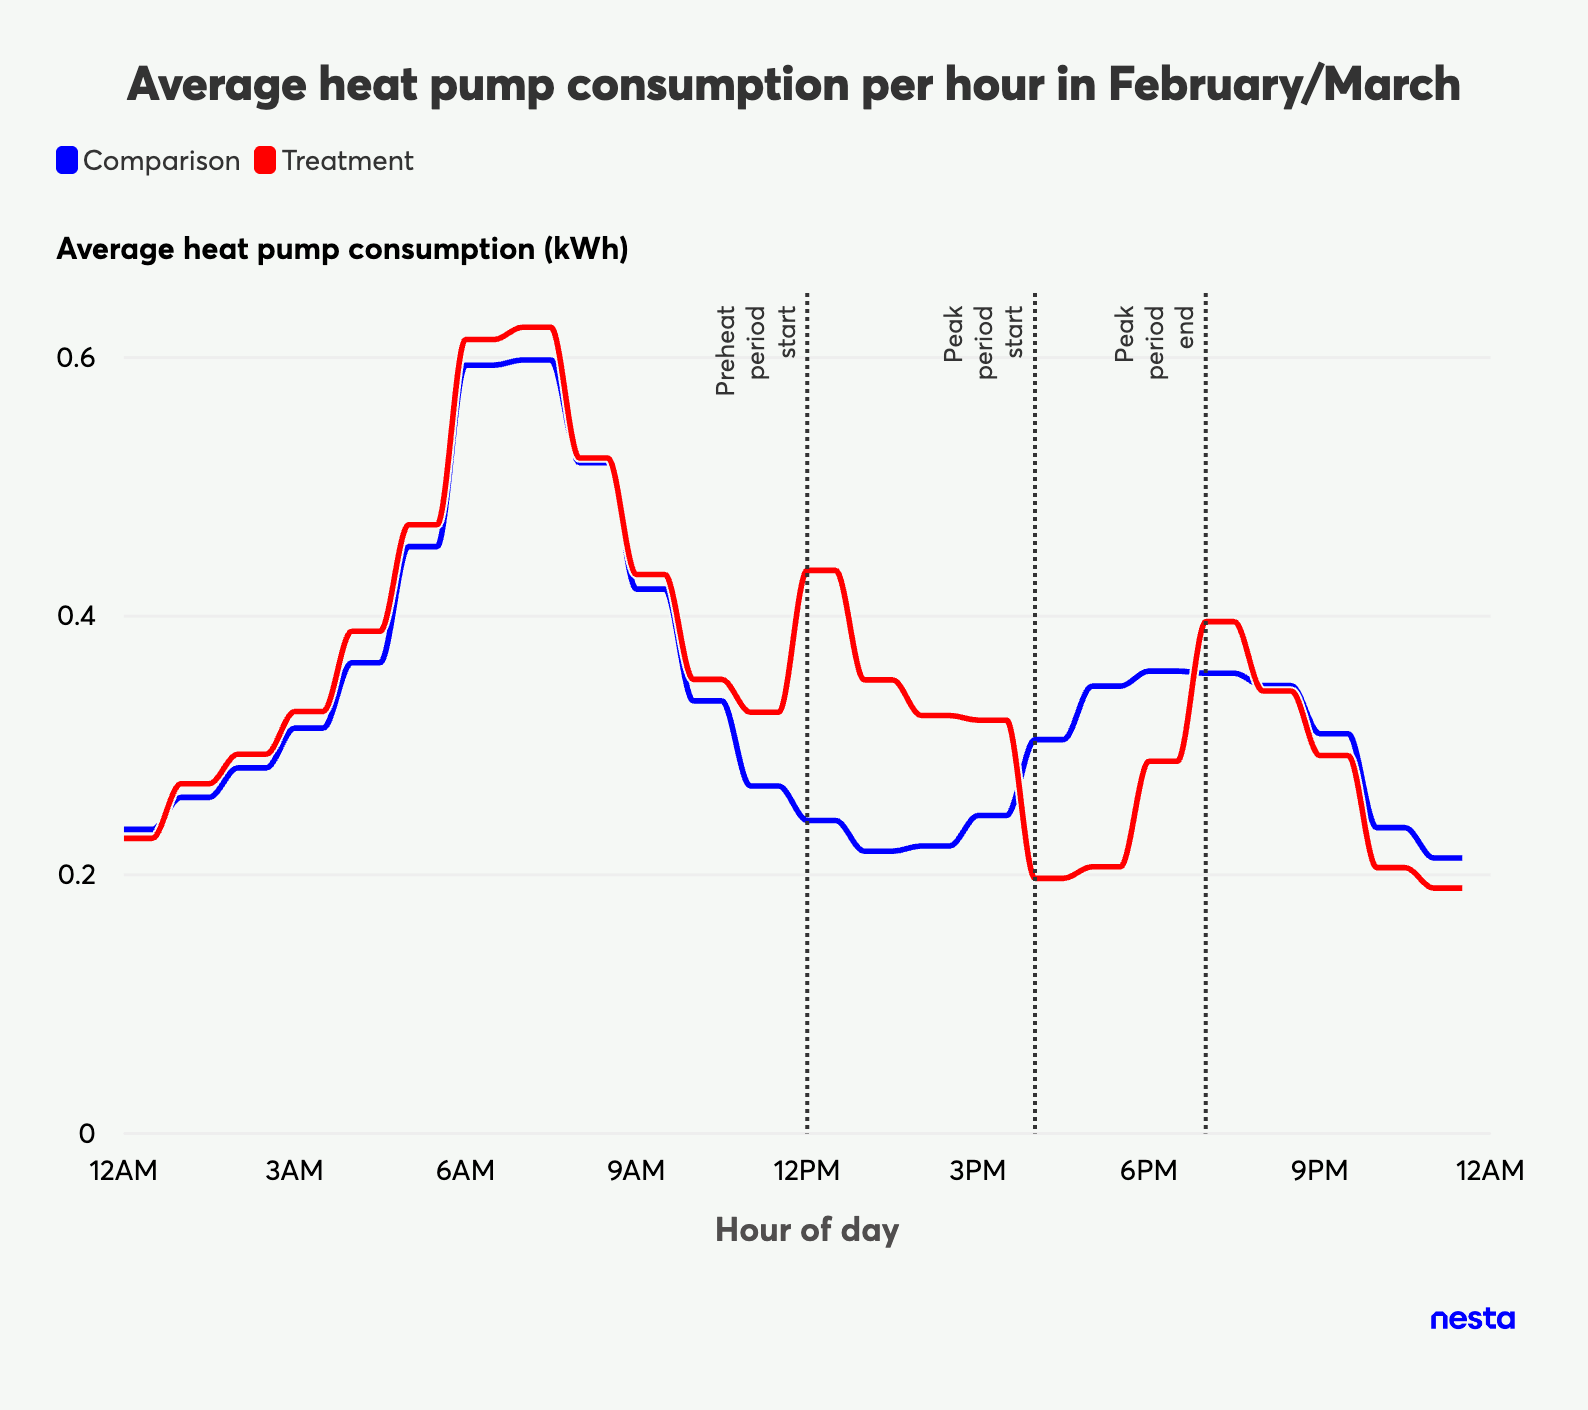
Figures 12 and 13: Mean hourly electrical consumption, measured in kWh, of participants' heat pumps in both January and February/March across a 24-hour period.
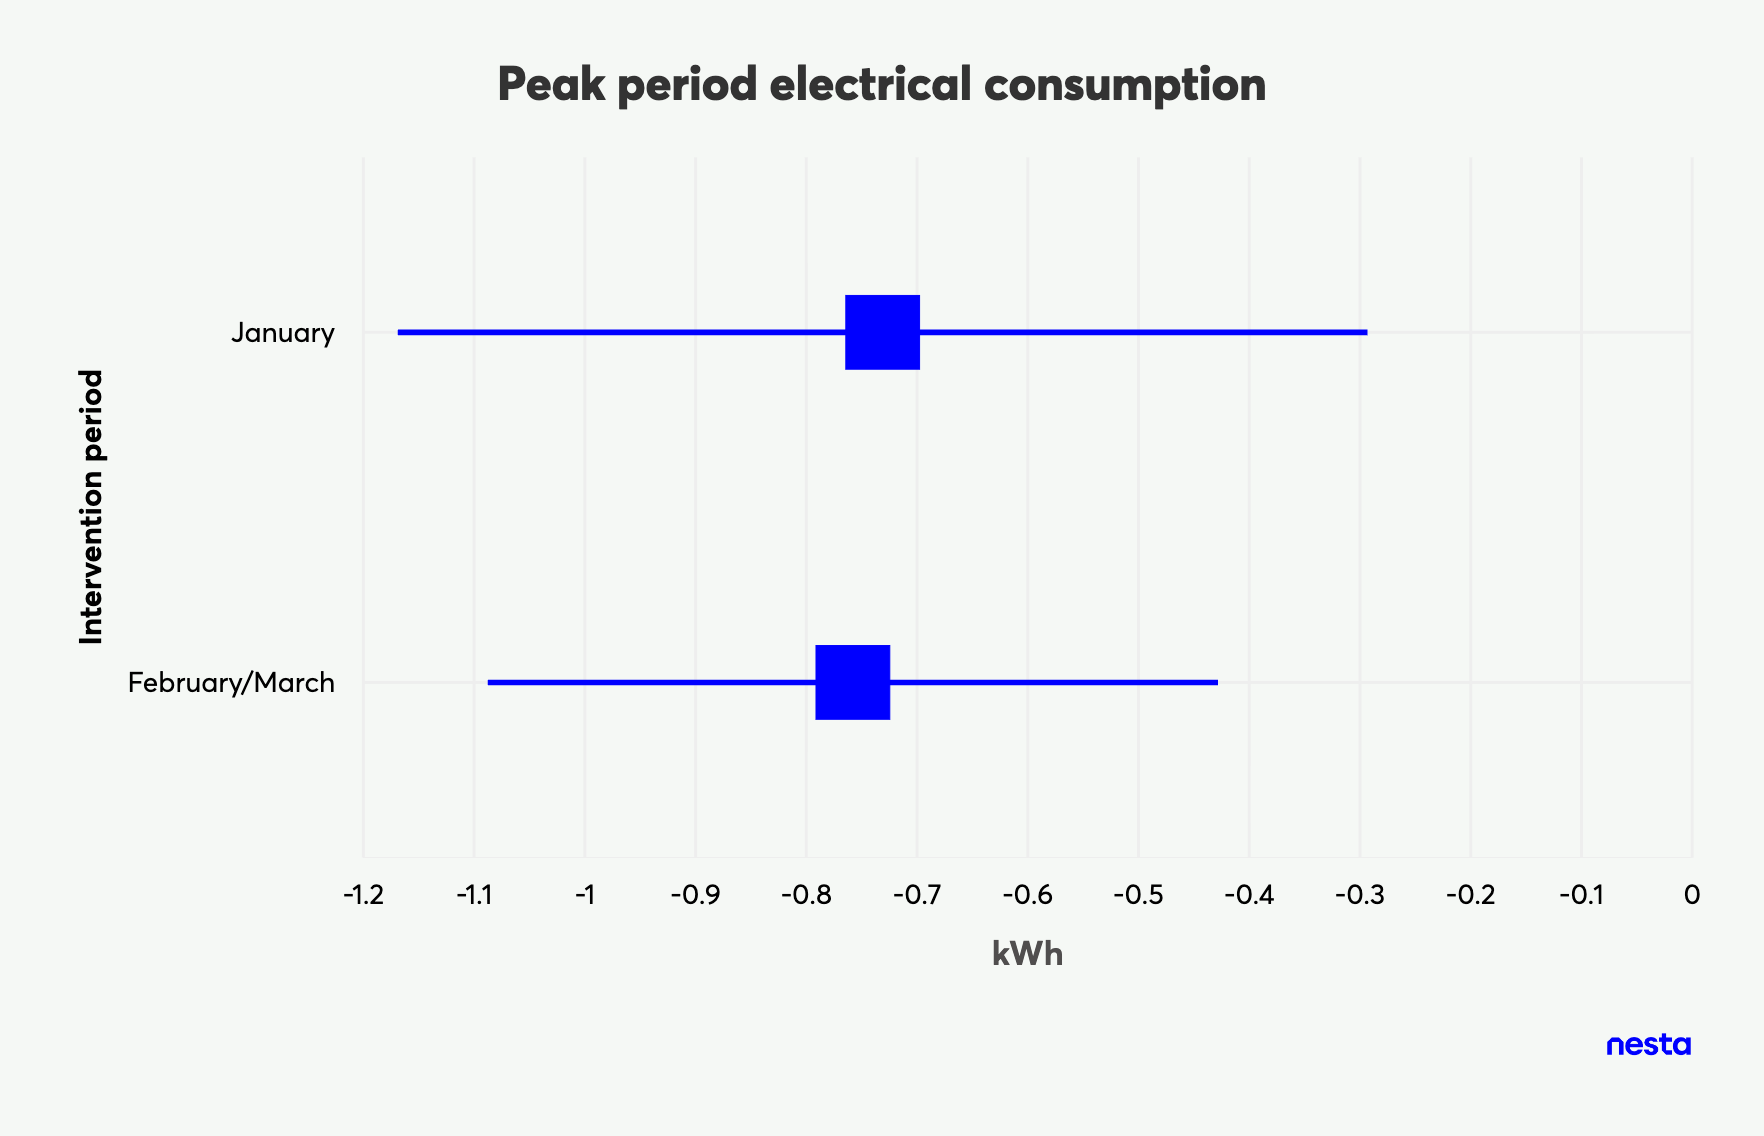
Figure 14: Peak period (4pm-7pm) heating consumption in January and February/March. January shows a mean reduction of 0.73 kWh with p = .001 and 95% Confidence Intervals: -1.17; -0.29. February/March shows a mean reduction of 0.76 kWh with p < .001 and 95% Confidence Intervals: -1.09; -0.43.
Our results were inconclusive about whether taking part in events during the intervention affected daily heat pump consumption
To explore whether our intervention affected heat pump consumption across a whole day, we compared daily heat pump consumption between those who took part in events and the comparison group. For both months, we did not find strong evidence of a difference between average daily heat pump consumption for those taking part in the trial compared to the comparison group. For January, we estimated that daily heat pump consumption was 0.17 kWh higher for those who took part in events compared to the comparison group (p = .897, 95% Confidence Intervals: -2.46; 2.81); and 0.14 kWh higher in February/March (p < .898, 95% Confidence Intervals: -1.99; 2.27). As indicated by the wide confidence intervals that
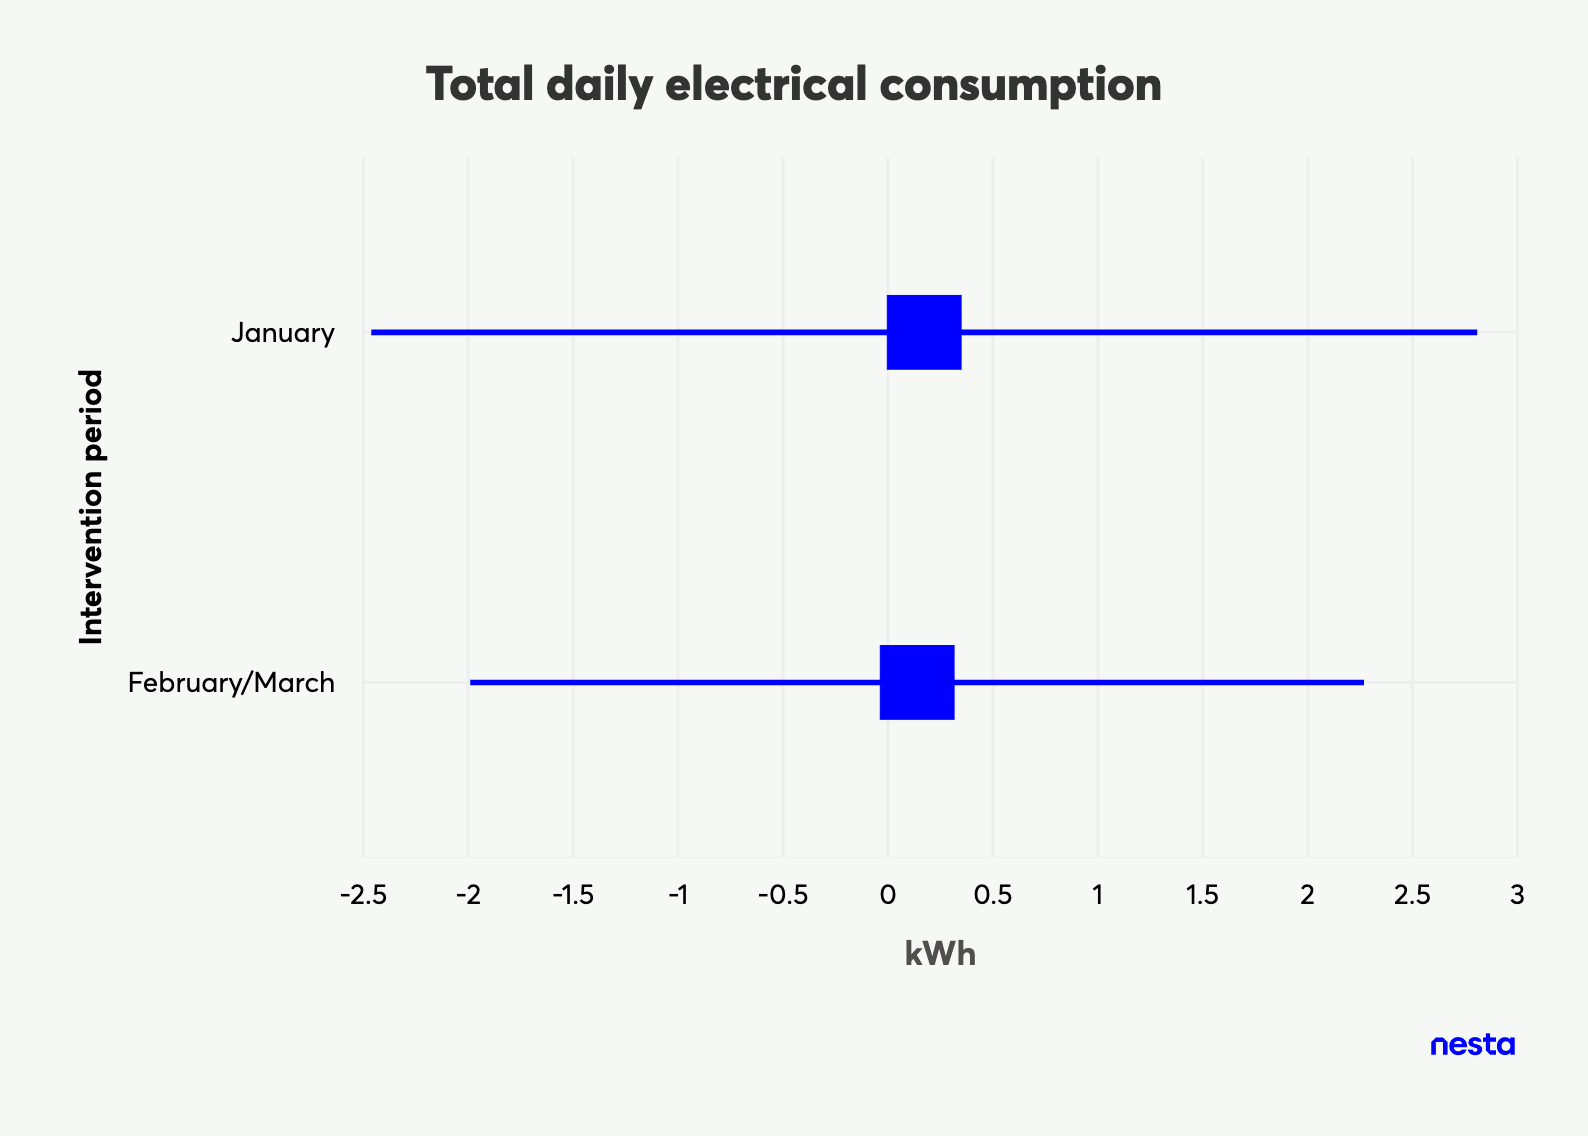
include 0, our results are inconclusive about whether our intervention results in a change in daily heat pump consumption.
Figure 15: Total daily electrical consumption for the intervention periods in January and February/March. January shows an estimated increase of 0.17 kWh with p = .897 and 95% Confidence Intervals: -2.46; 2.81. February/March shows an estimated increase of 0.14 kWh with p < .898 and 95% Confidence Intervals: -1.99; 2.27.
Our results were also inconclusive on whether our intervention affects daily COP
Daily average COPs were monitored and compared between the treatment and comparison groups. For both months, we did not find strong evidence for a difference in daily COP (point estimate for January is -0.03, p = .805, 95% Confidence Intervals: -0.30; 0.23; point estimate for February/March is -0.09, p < .571, 95% Confidence Intervals: -0.39; 0.21). As with our analysis of daily electricity consumption, the confidence intervals for both periods are wide and include 0,
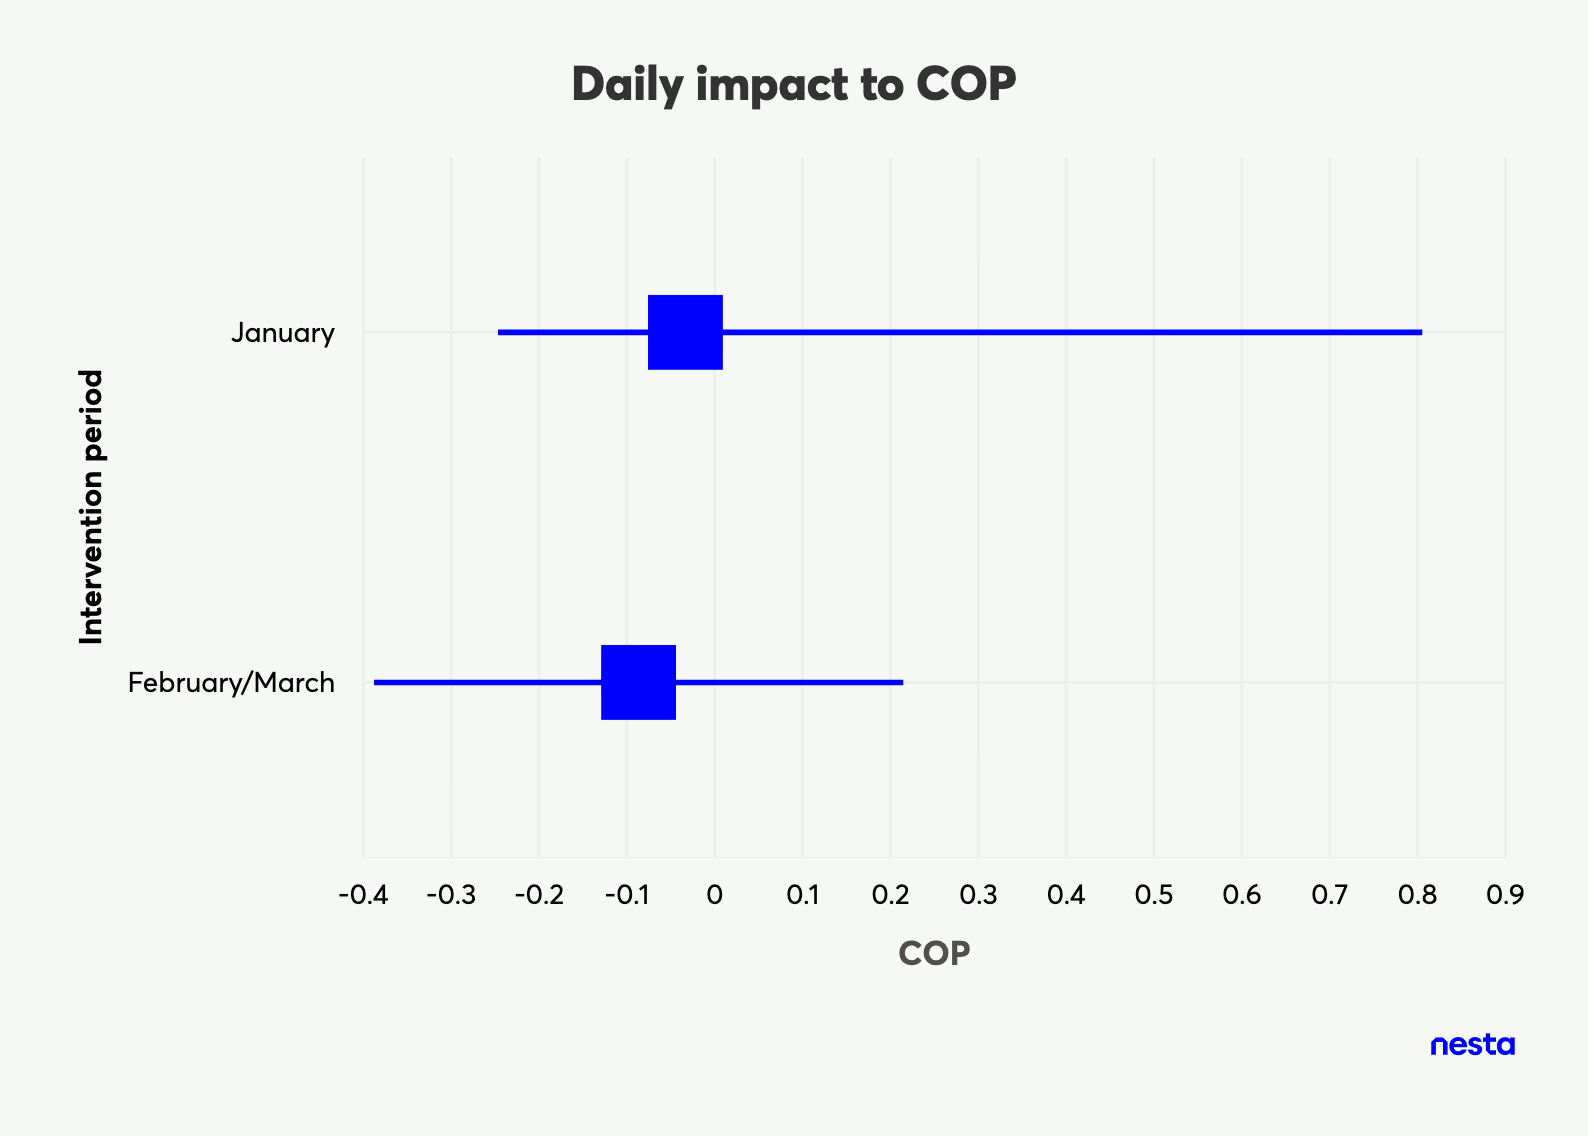
meaning that our results are inconclusive about whether our intervention affects COP.
Figure 16: Total daily change impact to COP for January and February/March. Estimated change in January is -0.03 with p = .805 and 95% Confidence Intervals: -0.30; 0.23. Estimated change in February/March is -0.09 with p < .571 and 95% Confidence Intervals: -0.39; 0.21.
Household experience
This section presents participants' experiences of our intervention. We had a particular focus on whether participants had noticed any thermal changes as a result of our control, their satisfaction with internal temperatures, and comfort with automation. We recorded people's experience in a number of ways, including weekly surveys administered throughout the trial, a mid-point and endline short interview (conducted by an AI-powered interviewer) and an additional six human-led semi-structured interviews. We also recorded which households decided to manually override our intervention schedule by changing their heating. We received very high response rates to both our weekly surveys and AI-powered interviews, with a 95% completion rate across weekly surveys and 78% completion rate for AI interviews.
Participants reported high levels of satisfaction with their internal temperatures
Participants were provided with a survey at the end of Wednesday each week during the trial. Survey questions asked how satisfied their household was with their internal temperatures. From 604 survey responses across 58 households during the trial period (January to March 2025), 88% of responses were satisfied, 7% were neutral, and only 5% were dissatisfied. We rated satisfaction on a scale from "Very dissatisfied" to "Very satisfied", as shown in Figure 17 below. Of the responses grouped together into "Satisfied" (n=530), the majority were either “Satisfied” (n=290) or “Very satisfied" (n=171) rather than "Somewhat satisfied" (n=69). Of the responses grouped together into "Dissatisfied" (n=30), the vast majority were “Somewhat dissatisfied” (n=24) rather than "Dissatisfied" (n=4) or “Very dissatisfied” (n=2).
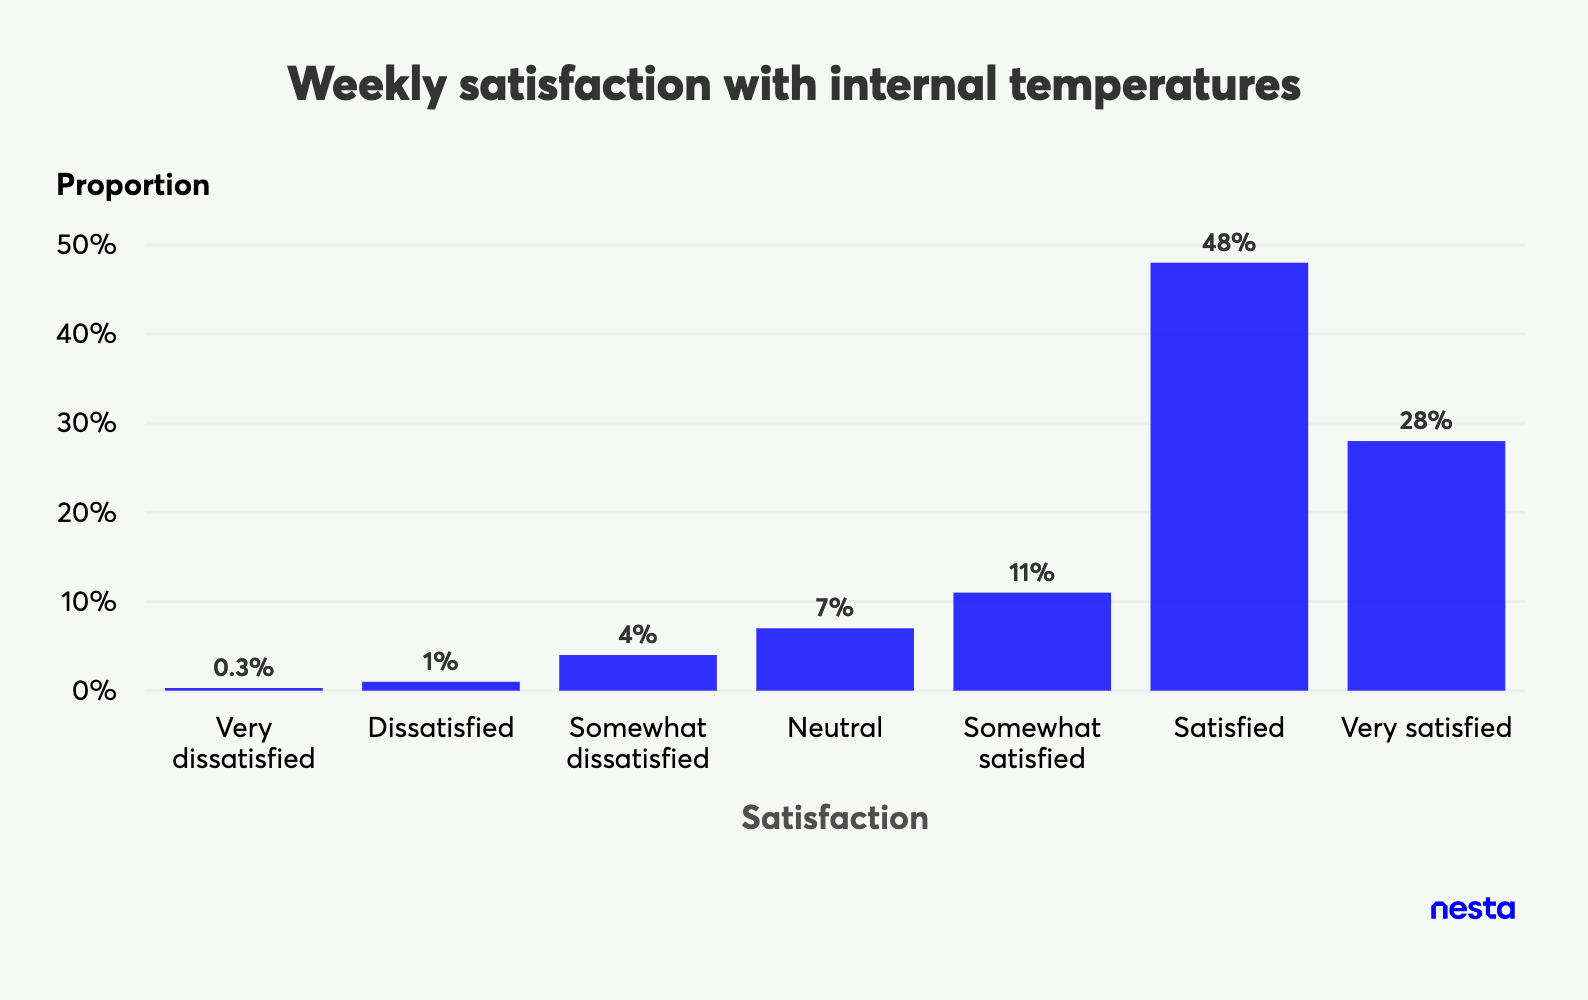
Figure 17: Responses to the weekly survey question "How satisfied was your household with the internal temperature in your home during the past week?" (n=604). Excluding responses where participants indicated they were not home for the week (n=12).
Levels of satisfaction remained high across the entire trial period, although we did observe an increase in satisfaction from 81% in January (n=132) to 90% in February (n=198) and March (n=200). This increase in satisfaction may have been due to the increased preheating period, with participants like Wallance saying “It had gotten a little bit chilly over dinner time, then the preheating period was extended to four hours". It is possible that a number of other factors, such as increased familiarity with the trial or increasing external temperatures, may also have been contributing factors to the observed increase in satisfaction.
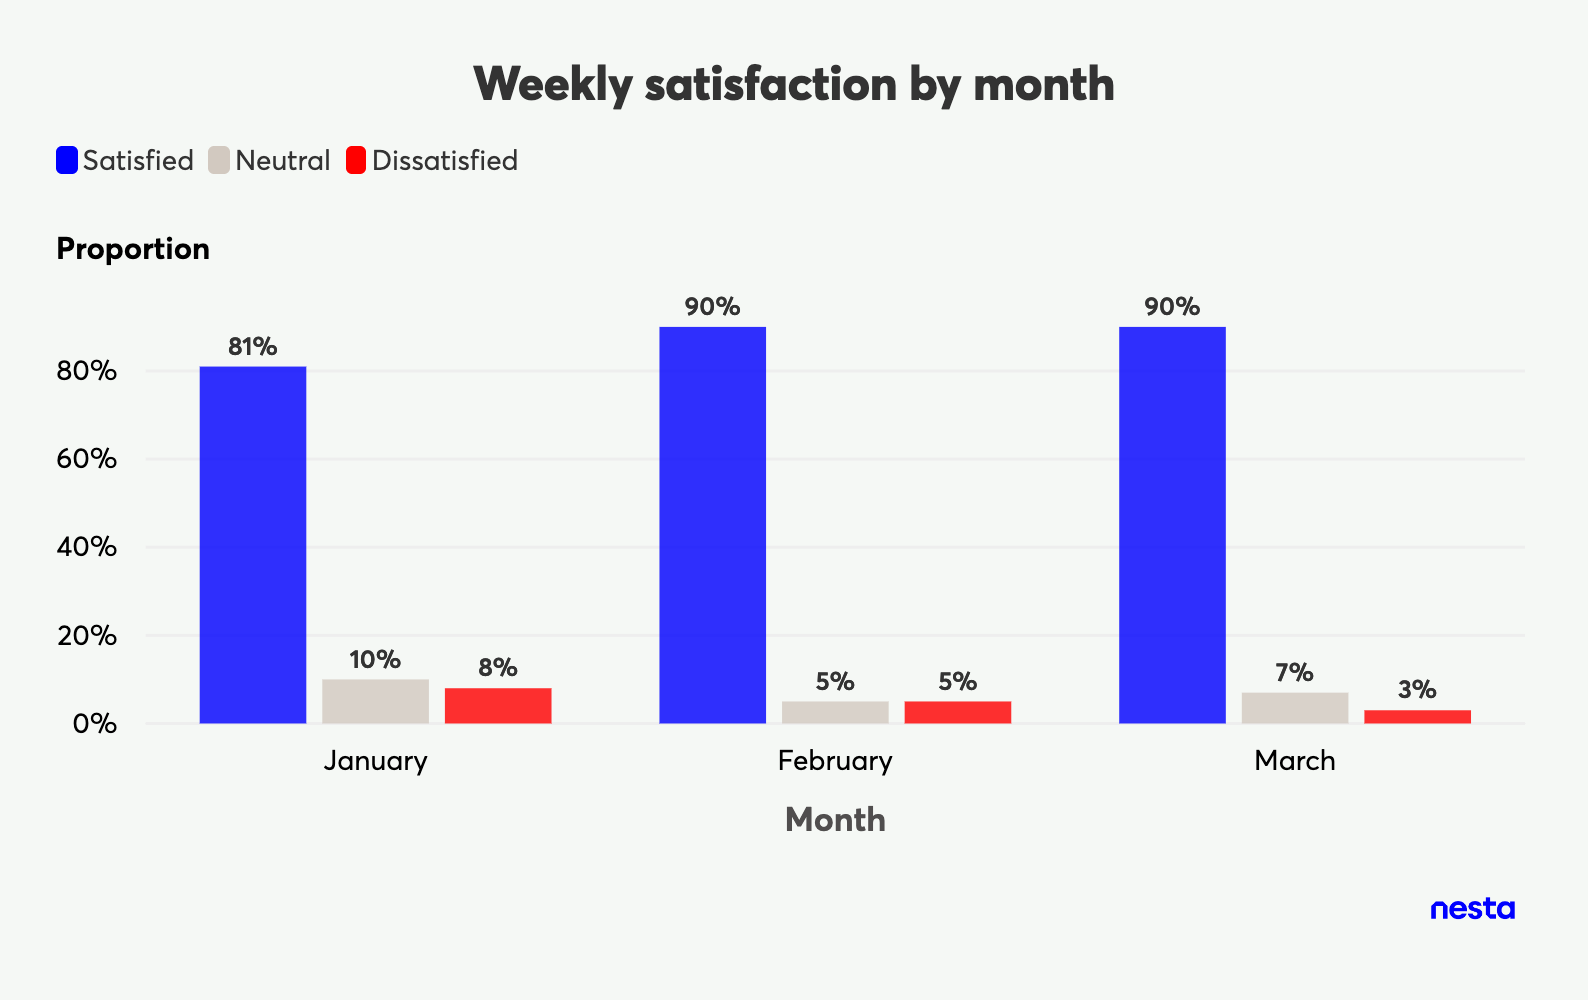
Figure 18: Responses to the weekly survey question "How satisfied was your household with the internal temperature in your home during the past week?", separated by intervention period.
We heard from AI- and human-led interviews that participants were generally comfortable with their homes' temperatures during the trial
We asked participants how comfortable they had found their homes during the trial via both mid-point AI and human-led interviews. Most responses from the AI-powered interviews expressed high levels of satisfaction (39 cases from 46 AI interviews). Sofie said, “The house has been really comfortable despite some cold weather". A small number of participants even reported finding their homes to be more comfortable than prior to the trial. Alfred told us, “With the new heating settings, it has felt more homely than before the trial, it is nice to wake up in a warm home".
Of those households who reported being comfortable during interviews, over a third also mentioned feeling “cool” or “colder” on some particularly cold days or in the evenings. Rob was one such case, who described how he “Found the house really comfortable” but “a little cool in the morning”. There were only three cases where participants explicitly stated that they felt less comfortable, such as in the case of Jeremy, who said, “It's hit and miss, we felt cooler in the house than we wanted".
Overall, most households had not noticed OVO's control during the trial
In the weekly surveys, participants were asked whether they had noticed a difference in comfort that was caused by OVO's control. From 603 survey responses across the trial, 60% (n=363) reported that they had not noticed any difference in comfort as a result of OVO's control. Of the remaining responses, 36% (n=215) reported that they had noticed a difference, and 4% (n=25) responded that they didn't know. We also asked participants during our midpoint AI interview whether there were any times they thought we had been controlling their heating. From 46 interviews, 30 said things like “I haven't noticed OVO making changes” or “I haven't noticed any real change in the temperature of the house”.
Of those people who did notice changes to their heating controls, the main reason cited was the difference in their scheduling app. Martina described how “We saw on the OVO app that the temperature has been adjusted slightly, but otherwise I don't think we would have noticed”. Participants like Darren mentioned they noticed a difference because “Sometimes on colder evenings, it's a bit on the cool side". Interestingly, a few participants who had noted cooler evenings earlier in the interview also stated that they had not noticed OVO's control, implying that they may have found the evenings cooler prior to the trial.
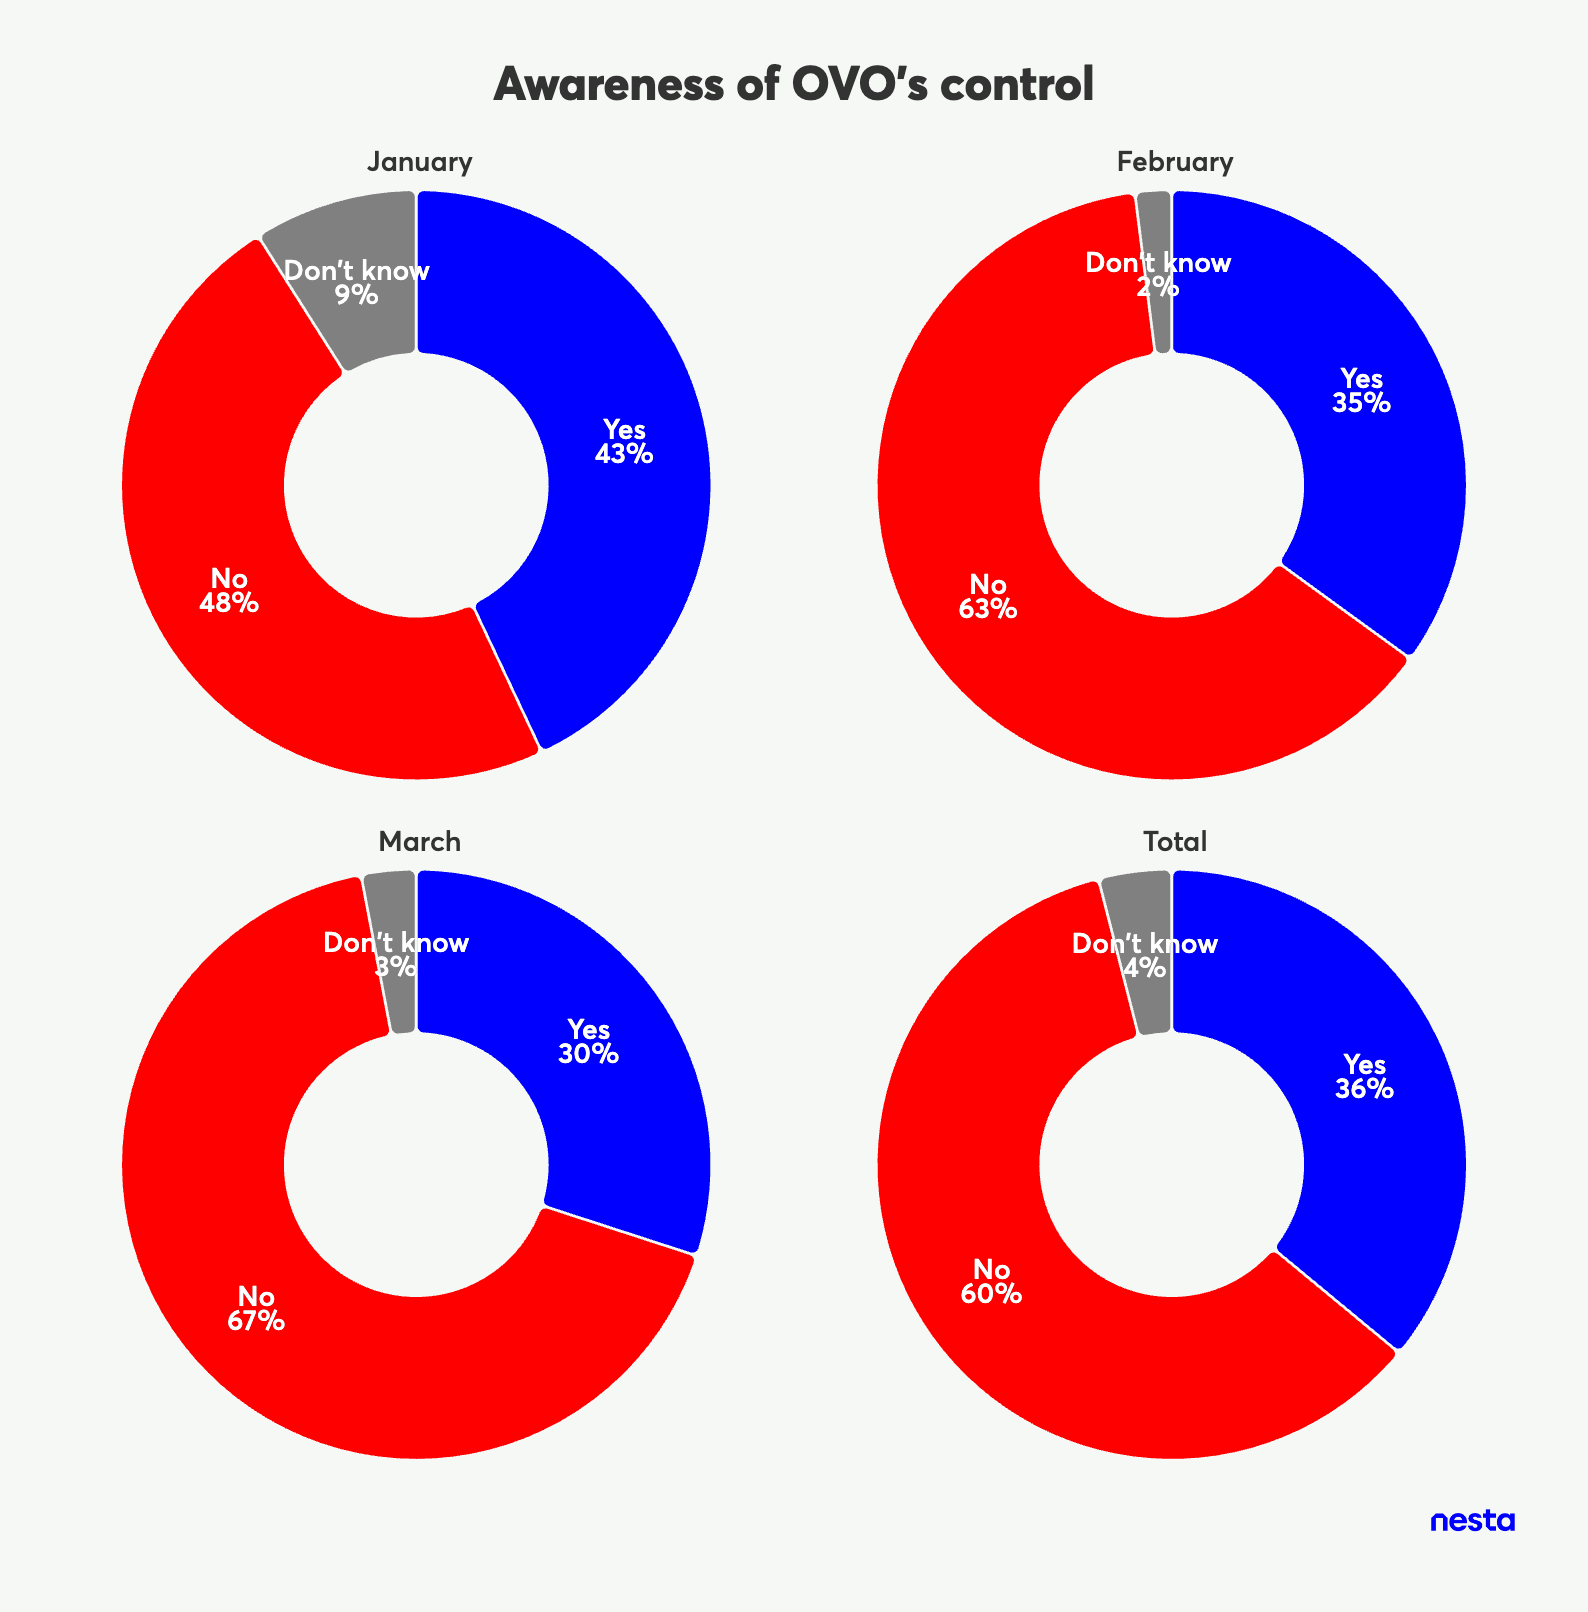
Figure 19: Responses to the weekly survey question "Did you notice a difference in your thermal comfort at home this week that was caused by our control of your heating?" (n=603). Excluding responses where participants indicated they were not home for the week (n=12).
Participants very rarely overrode our control across the intervention, preheating and peak periods
We recorded whether participants used their boost heating function on their heat pumps during our intervention period, effectively overriding our control. Recording the frequency of overrides across households was used as a metric to understand whether they felt comfortable with their internal temperature. Participants were not notified of the timing of our intervention, and so would not have been aware that they were overriding our schedules (although some deduced the intervention structure by looking at their schedules). We found that manual overrides during preheat or peak periods occurred very infrequently across the trial, with 1% in January and 2% in February/March. The frequency of the boost function being used was also very similar to that of our comparison group, suggesting that participants very rarely felt the need to change their home's temperature in response to our intervention.
Participants felt they had not made any changes to their usual routines, although some reported adaptive measures such as using supplementary heating or changing clothing
During the midpoint AI interview, participants were asked to think about what they did between 5pm and 9pm during a normal weekday, and whether they had made any changes to their usual routine since the trial began. The majority of participants (40 from 46 interviews) stated that they had made no change to their routine. One participant said that the trial had positively changed their routine. Jessica told us, “I have more baths in the evening with the changes, before joining the tria,l it was much colder in my bathroom”. A small number of participants told us in the AI interviews that they altered their setpoint temperatures, adjusted their weather compensation curve, or moved their smart thermostat. Rosie described how her husband felt warmer than her and would “Occasionally move the thermostat and put it in the water tank cupboard" since starting the trial.
The most common adaptive measure from our survey was adding more layers of clothing (n=144), although a large number (n=61) also reported that they didn't notice any difference in thermal comfort or didn't know. We heard from people like Tom that "When the outside temperature is below 7°C we often put on a thicker sweater". Log burners or fan heaters were relatively common (n=79) with almost half (n=40) of cases being from those that didn't notice any difference in thermal comfort or didn't know. The AI interviews contained a few references to additional heat sources being used, with Greg telling us “We do use a wood fire...but we're used to that. We live in a really old house". The regularity of adaptive measures being taken alongside reports of people not noticing any change in thermal comfort implies that these are measures that were regularly taken prior to our intervention.
There were also a number of cases from weekly surveys of participants reporting that they had changed their setpoint temperatures (n=72) or boosted their heating (n=38). A variety of reasons for these adaptations were given, such as increasing temperatures for visiting family, increasing set back temperatures overnight, reducing setpoint temperatures as exterior temperatures increased, and boosting during cold spells.
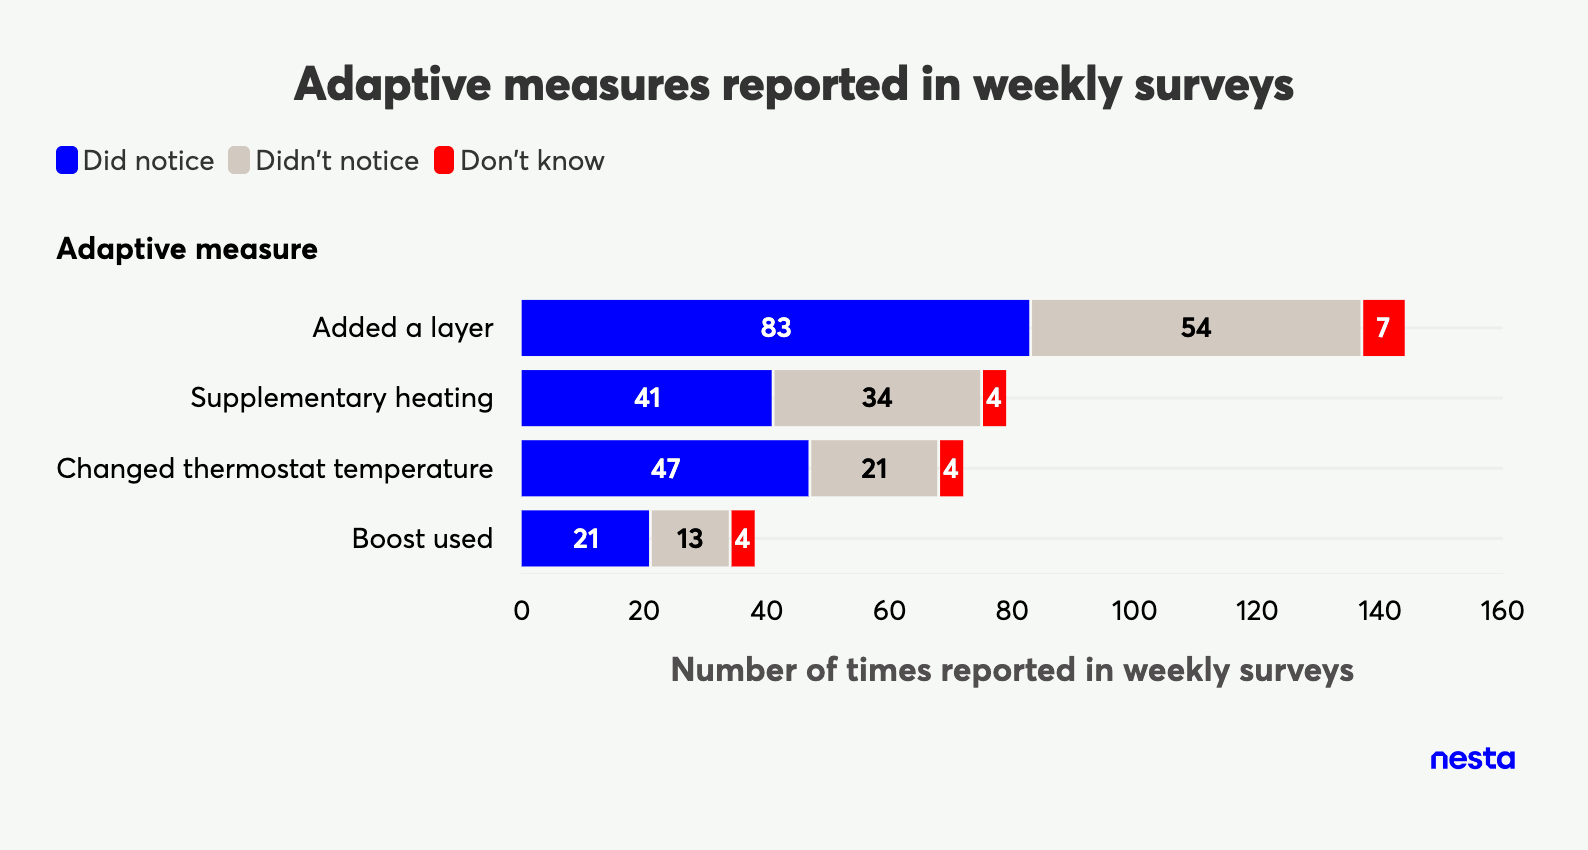
Figure 19: Total responses to the weekly survey question "Did you or anyone in your household do any of the following to maintain comfort?"
Overall, households that took part in the trial had a positive experience
Almost three-quarters of the people we interviewed said they had a positive overall experience of the trial. Reasons included that the trial felt “smooth” and “easy" to take part in, that their “home has been comfortable”, or that they had not noticed any “adverse effects” by taking part in the trial. There were 11 participants who responded with neutral sentiment, such as “it was okay” or “on average, not bad". One person reported that they had a negative experience with the trial, reporting that their home was too cold and the intervention had not adequately accounted for external temperatures. This overwhelmingly positive feedback from participants underscores the high potential for successful integration of automated flexibility into heat pump tariffs, as it demonstrates that such interventions can be implemented without significantly compromising user comfort or satisfaction.
A commonly recurring theme we heard was the desire for increased levels of communication from us. We heard from a number of people that “it would be nice to be notified when you made changes” and “it would be interesting to have reports on the temperature changes in my house". This was to be expected, as we had purposely avoided telling participants about the structure or timing of our intervention to reduce the risk of changes to behaviour. The prevalence of this desire highlights the importance of communication for some people. Notification of events occurring and feedback on the outcome could increase satisfaction even further.
Overall, households were willing to allow continued remote automation of their heat pump, although some expected additional incentives
Participants who had good experiences of the trial and found OVO's optimisation of their heating desirable reported that they would be happy to continue allowing OVO to remotely control their heat pump without an additional incentive. For example, in an AI-powered interview, Damien said, “I'm disappointed they (OVO) stopped", adding that he enjoyed the “Better comfort temperature-wise and freedom from having to think about optimal settings". This finding is encouraging as participants had motivations for adopting an automated type-of-use tariff that were not purely financial.
Additional conditions included being able to maintain their comfort in the case of dropping temperatures by retaining the ability to override the remote control, and being provided with more information about the types of changes being made to their heating. Other participants suggested different forms of incentives would be useful in order to continue automating their heating, such as financial-based incentives, including reduced tariff rates, reductions to standing charges, bill credit, and running cost guarantees. Two participants felt unsure whether they would be comfortable providing continued control to OVO and one participant clearly stated that they would not accept continued automation.
Limitations
The findings from this trial provide significant confidence for the viability of incorporating automated flexibility into type-of-use tariffs. Despite us considering the trial a success, it is important to note that there are limitations to these findings.
- Our use of matching for our causal inference approach has a number of limitations. We were not able to use a comprehensive set of matching variables, meaning that there may be differences between our treatment group and comparison group in key unobserved variables. This means that we cannot be sure that differences in our outcome are solely due to the involvement in events. For instance, we know that households in the treatment group were willing to take part in the trial, whereas those who are in the comparison group did not express an interest in taking part, which could cause differences in our outcome. This limits our confidence in our results and our ability to claim a causal impact of our intervention.
- Our sample was small, limiting our ability to detect small differences between those who took part in the trial and those in the comparison group. We found a number of non-significant findings, such as daily heat pump consumption and COP. These findings do not suggest an absence of an effect; instead, it may be that our small sample size limited our ability to detect small differences between the two participant groups.
- Sample generalisability and size. Heat pumps are not very common in the UK, currently heating less than 1% of households. Individuals who have chosen to install a heat pump could be considered to be innovators or early adopters, potentially displaying different behaviour or attitudes relative to the UK general population. Our total sample size was small, although large in comparison to previous flexibility trials, limiting confidence in how representative our sample would be compared to the wider UK population.
- The majority of participants were in their first winter with a heat pump. ~57% of participants in the treatment group reported having a heat pump for less than a year. This could have affected our participants' ability to reflect on the impact they felt from our intervention, as they had a limited experience of colder temperatures with a heat pump as a reference point.
- Not all households responded as expected to our intervention. In January, we observed the expected internal temperature profile for 53% of the participants, increasing to 62% in February/March. Of the remaining participants, we observed three other temperature profiles that we classified as "constant heating”, “constant cooling”, or “other”. This may mean that not all households were successfully treated, potentially impacting our qualitative findings.
- Not all participants completed AI interviews and human-led interviews. Across the trial, we had very high levels of participation; however, 22% of individuals did not complete our AI interviews. We also sent out 14 invitations to human-led interviews, with only six being accepted. This means that a portion of our participants may not have had their experiences included in our results. This introduced the potential for bias, as those who responded may have felt differently from those who didn't. The very high levels of weekly survey completion, 95%, mitigate this concern to a large degree.
- Surveys and interviews were delivered to the contact information of the account holders, limiting the inclusion of the household members' experiences. During our interviews, we asked whether other members of the household had a different experience of the trial, although this question was mostly answered by the account holder. It is worth noting that 79% of these account holders were male, who typically have a different experience of temperature from females.
4. Implications
We hope that the findings from this research will be informative in the further development of type-of-use tariffs, such as Heat Pump Plus. Currently, we believe that the following implications stand to benefit a range of stakeholders, such as consumers and energy suppliers. We also highlight some of the changes across the industry and energy system that could facilitate the widespread adoption of tariffs by consumers.
- We found no evidence to suggest that our treatment group experienced an increase in average daily electrical consumption from their heat pumps, although we note that there might be small differences that we weren't able to detect. It would follow that the impact on average daily bills should be negligible, but we would encourage future research to confirm this.
- Automation could be a way to reduce the cost of type-of-use tariffs. By automating heat pump operation, the overall cost of energy supplied to consumers on these tariffs could be lowered by shifting consumption away from times at which the cost of electricity is high.
- There is scope for lowering costs by trading in flexibility markets. The ability to shift demand through automation opens up opportunities for energy suppliers to reduce their own costs and participate in flexibility markets, delivering ancillary services like frequency response or balancing services.
- Consent to automation could be bundled with type-of-use tariffs. To increase adoption and harness the benefits of flexibility, agreement to automated control could be a standard feature of type-of-use tariff agreements.
- There is an increased incentive for electricity suppliers to ensure heat pumps are working well. As automation becomes integrated with tariffs, suppliers will have a vested interest in ensuring the optimal performance of heat pump systems to maximise load shifting and customer satisfaction. Poorly performing systems could be identified remotely, further reducing operational costs and increasing the lifespan of heat pumps.
- It is important for heat pump manufacturers to focus on making them automatable. For widespread adoption of flexible tariffs, heat pump manufacturers need to prioritise developing and implementing controls that can be easily integrated, interoperable and automated.
- There is synergy with potential innovations like multiple supplier arrangements. Automated flexibility could work well with future energy market models, such as those involving multiple energy suppliers, allowing consumers to benefit from tariffs that cater to their assets or behaviour.
5. Conclusion
This research trialled the incorporation of automated flexibility into Heat Pump Plus, developing our understanding of how optimised heating schedules can be used to shift demand resulting from space heating away from peak periods on the grid. In particular, this research has focused on how novel type-of-use tariffs combined with automated flexibility can be used to reduce running costs for heat pump owners, whilst also ensuring high levels of comfort in an unobtrusive manner.
We successfully managed to shift a significant proportion of our samples' heating demand away from a peak period between 4pm-7pm, on consecutive days every Monday to Friday through the winter months of January to April. Our results were inconclusive about whether COP or total daily consumption is affected. Nonetheless, these findings support the notion that heat pumps can be used flexibly to reduce consumption at times when demand is greatest on the grid. Survey and interview findings suggest that this load shifting was possible with very high levels of satisfaction, often going unnoticed by the participants. We found that the vast majority of participants would be happy with automation being introduced to their current tariff, although some found additional incentives to be necessary.
These findings mean that heat pump owners could make use of automated type-of-use tariffs such as Heat Pump Plus and potentially save up to £440 per year compared to a standard variable rate. This would also provide grid management services, reducing the need for expensive infrastructural upgrades, and helping to decarbonise our energy system as we reduce our reliance on carbon-intensive sources of electricity generation.
6. Appendix
Approach for statistical inference
Matching methodology
To investigate the causal impact of flexible heating on heating consumption, we used regression models paired with a statistical technique called Coarsened Exact Matching (CEM). This approach enabled us to create a valid comparison group out of households that were eligible to participate in our trial, but did not wish to take part in our trial or were unable to be invited to the trial (approximately 320 households were identified that could be used in the comparison group). The use of matching aimed to create a comparison group that is similar in terms of observable characteristics to the households that took part in the trial, by (a) identifying similar households (and excluding dissimilar households), and (b) weighting observations to further enhance similarity and increase the potential number of households in the comparison group (compared to pairwise matching).
We used the following variables for matching:
- Coarsened average daily heating consumption in the month prior to trial recruitment (bins of 4 kWh, truncated at 24 kWh). Note that the average is estimated from between 7 and 31 days of data available.
- Electricity estimated annual consumption (bins of 2,000 kWh, truncated at 12,000 kWh).
These variables were selected based on data availability and reviewing matching success. We were limited in terms of potential variables that could predict our outcome (heat pump consumption) – such as house size and heat pump size - due to households in the non-participant group not completing our onboarding survey (which was our sole source for contextual household information). The lack of a rich set of variables for matching could result in a higher chance that our comparison group differs from the trial participants, which could result in differences in our outcomes due to differences in unobservable characteristics.
After matching, our comparison group decreased to 231 households, as we excluded households that were very dissimilar to our participating households. We qualitatively reviewed the graphical balance between the treatment group and the comparison groups to give us confidence that the two groups were similar in terms of observed characteristics.
Below, we present the descriptive statistics for the comparison group and the treatment group. We observe similar statistics between both groups, indicating that matching successfully resulted in the comparison group being similar to the treatment group with respect to observed variables.
| Variable |
Comparison group (n = 231) |
Treatment group (n = 43) |
|
% (n) |
% (n) |
| Region |
|
|
| Eastern England |
10% (22) |
14% (6) |
| East Midlands |
6% (14) |
5% (2) |
| London |
4% (4) |
2% (1) |
| Merseyside and Northern Wales |
2% (7) |
2% (1) |
| West Midlands |
2% (6) |
5% (2) |
| North Eastern England |
3% (9) |
5% (2) |
| North Western England |
9% (15) |
5% (2) |
| Northern Scotland |
18% (42) |
19% (8) |
| Southern Scotland |
11% (17) |
9% (4) |
| South Eastern England |
8% (19) |
7% (3) |
| Southern England |
15% (41) |
5% (2) |
| Southern Wales |
4% (12) |
7% (3) |
| South Western England |
3% (9) |
12% (5) |
| Yorkshire |
5% (14) |
5% (2) |
| Estimated annual consumption |
|
|
| 0% to 20% |
2% (1) |
2% (1) |
| 20% to 40% |
3% (3) |
5% (2) |
| 40% to 60% |
4% (8) |
5% (2) |
| 60% to 80% |
28% (75) |
28% (12) |
| Missing |
63% (144) |
60% (26) |
|
Mean (sd) |
Mean (sd) |
| Heating Degree Day |
10.09 (1.12) |
9.92 (1.06) |
| Average peak household consumption (kWh) |
0.67 (0.33) |
0.65 (0.47) |
Table 1. Descriptive statistics for covariates used in analysis (n = 274). Note, the comparison group has had weighting applied. Heating Degree Days is defined as (15.5 °C - temperature) if the temperature is below 15.5 °C; for temperatures above 15.5 °C, it is 0.
Below, we show the descriptive statistics for our outcomes.
| Variable |
Comparison group Mean (sd) |
Treatment group Mean (sd) |
| January analysis |
|
|
| Electricity consumption during peak period (kWh) |
2.86 (1.60) |
2.22 (1.34) |
| Electricity consumption across whole day (kWh) |
21.31 (10.40) |
21.75 (10.66) |
| Seasonal COP |
3.64 (0.75) |
3.65 (0.77) |
| February and March analysis (longer preheating period) |
|
|
| Electricity consumption during peak period (kWh) |
2.09 (1.27) |
1.45 (0.87) |
| Electricity consumption across whole day (kWh) |
15.76 (7.91) |
16.44 (7.67) |
| Seasonal COP |
3.89 (0.87) |
3.86 (0.81) |
Table 2. Descriptive statistics outcomes. Note, the comparison group has had weighting applied for continuous variables.
Analysis methodology
To estimate the impact of taking part in events on our outcomes of interest, we used multivariate regression analysis, which included the following adjustment variables (which were selected due to their correlation with heat pump consumption):
- Region
- Estimated annual consumption
- Average peak household consumption
- Heating Degree Days (defined as (15.5°C - temperature) if the temperature is below 15.5°C; for temperatures above 15.5°C, it is 0)
We conducted separate analyses for the intervention period in January, and the period in February/March, due to the preheating and flexibility durations differing between these two periods.
We conducted a number of different analyses to support our main analysis:
- Robustness checks. We conducted placebo tests using only data from weekends (when events weren't conducted). We found no significant differences in the outcomes of interest between the trial and comparison group.
- Sensitivity analysis. We conducted various analyses using different combinations of matching variables. We found that the results were largely consistent with the main results. We also conducted further sensitivity analysis using a subset of homes where the internal temperature was consistent with a load shift occurring (ie, internal temperature increases in the pre-heat period and decreases in the peak period). We found that the effect size for the difference in heat pump consumption between the trial and comparison group was greater than the main analysis (where we used all participants), which aligns with our expected change (whereby more effective control of the heat pump would result in greater changes in consumption).
AI-powered interviews
We decided to hire Langwith Research to use their AI interviewer to conduct two rounds of AI interviews, a midpoint interview at the end of January and an endline interview in April. AI interviewers were employed in an attempt to capture the qualitative experience of as many participants as possible. These interviews aimed to help us understand the lived experience of participants interacting with our events, whilst gathering feedback on their preferences and desires for iterations to the tariff.
Interviews were only conducted with participants in the treatment group. Each participant was sent a personalised link via email containing an information sheet explaining the ethics, purpose and format of the interview alongside a link that led them to a WhatsApp chat. Participants were able to conduct the interview in their own time, pausing and returning to the interview as desired. Participants were encouraged to make use of the voice chat feature available on WhatsApp, but were also able to type their responses. The midpoint interview was typically completed within 15-25 minutes, whilst the endline interview was slightly shorter at 10-20 minutes.
We developed a topic guide as though we were conducting semi-structured human-led interviews. The topic guide was then uploaded to the interviewer, with questions being designated as static or dynamic. Static questions were asked verbatim, whereas the AI interviewer was able to mould dynamic questions to cater to interviewee responses. Our team then conducted a series of test interviews with the AI interviewer, adopting differing personas to test features such as interview completion times and the agility of follow-up questions. We also conducted "disruptor" interviews to observe how the bot would respond to interviewees who became argumentative or took offence to questions. Through iterative testing, we shortened the interviews and specifically modified questions to avoid repetition. The core question areas for each interview were as follows:
Midpoint interview
- Experience of participating in the trial
- Recent comfort in the home
- Awareness of periods of remote automation
- Comfort with providing OVO control
- Monitoring of heat pump consumption
- Experience of wider household
- Changes to usual routines
- Anything missing from the trial
- Free text responses
Endline interview
- Experience of trial as a whole
- What do participants think we did
- Continued automation in Heat Pump Plus
- Movement of thermostat
- Changes to room temperature mode
- Free text responses
We had 46 complete responses to our midpoint AI interview and 45 complete responses to our endline AI interview, an average completion rate of 78% from our 58 participants. We asked participants about their experience of being interviewed by a bot at the end of the midpoint interview: 95% of participants expressed a positive or neutral sentiment towards being interviewed by the AI interviewer, with only two participants providing negative feedback. Interview responses were then coded and a thematic analysis was conducted. To quality assure the analysis, colleagues were provided with samples of the interviews to code and review. The codebooks created by these reviewers were then compared and contrasted with the initial analysis. The finalised codebook was then used to create themes that were compared to the research aims and fed into the qualitative component of this report.
AI was used purely for data collection via the interview, whereas all analysis was human led by our project team at Nesta.
Human-led interviews
Six human-led semi-structured interviews were completed via Zoom during the trial. Interviews were 60 minutes in length, with participants provided with a £20 gift voucher as a thank you. The interviews took place between the midpoint and endpoint of the AI-powered interviews. The human-led interviews were designed to ensure we captured feedback from those with the following criteria:
- Those who felt less comfortable using the AI interviewer
- Those who did not complete the AI interview
- Participants with particularly poor experiences of the trial
- Primary account holders who were women
In total, we invited 14 individuals who fulfilled these criteria to interview with us, with six acceptances. The interviews were structured around the initial topic guide used for the development of the AI-powered interviews, with the addition of some questions we wished to test for use in the endline AI interview. We specifically tested questions about participants' attitudes towards continued automation as a feature of Heat Pump Plus, whether they had made any changes to their heat pump settings, and whether they had physically moved their thermostat during the trial.
Weekly surveys
Surveys were delivered to participants on the Wednesday of each week, via the email connected to their OVO account. These surveys were designed to be as short as possible to minimise survey attrition and asked the following questions:
-
How satisfied was your household with the internal temperature in your home during the past week?
- Very dissatisfied
- Dissatisfied
- Somewhat dissatisfied
- Neutral
- Somewhat satisfied
- Satisfied
- Very satisfied
- No one was home this week
-
Did you notice a difference in your thermal comfort at home this week that was caused by our control of your heating?
- Yes
- No
-
Did you or anyone in your household do any of the following to maintain comfort?
- Used a supplementary heat source (eg, wood burner)
- Put on more clothes or used a blanket
- Changed the heating temperature or schedule
- Boosted the heating
- I didn't do anything to maintain comfort
- Other (Please specify)
-
If you or anyone in your household made a thermal comfort adjustment, can you explain why?
-
Is there anything else you'd like to tell us?
We had a very high completion rate of 95% for weekly surveys during the trial, with 616 total responses, of which 606 were from participants who had not been away during the week. Responses where participants reported that they were not at home for the week were excluded from our analysis.
Endnotes
- The £443.77 saving is based on an air source heat pump with a UK average Seasonal Coefficient of Performance (or efficiency rating) of 2.8 and an annual consumption of 3689 kWh with the Heat Pump Plus add-on compared to OVO's average SVT rate of 27.03 per kWh.
- Participants were spread across the UK, with no onboarding criteria relating to location, although the majority of participants were located in England.
- We have used a significance threshold of 0.05 in this report to determine whether a finding is statistically significant or not.
- All participants have been assigned pseudonyms for the purpose of reporting. Participants' responses have had all identifying information removed to ensure participant anonymity.
- Participants did not require the installation of any additional hardware to take part in the trial.
- Domestic hot water was not remotely automated during the trial, participants were able to continue with their normal pre-trial regime. Only the electrical consumption from space heating was recorded and analysed to produce the results presented in this report.
58 Victoria Embankment
London EC4Y 0DS
+44 (0)20 7438 2500
[email protected]
X @nesta_uk
f nesta.uk
www.nesta.org.uk
ISBN: 978-1-916699-41-0
Nesta is a registered charity in England and Wales with company number 7706036 and charity number 1144091. Registered as a charity in Scotland number SCO42833. Registered office: 58 Victoria Embankment, London EC4Y 0DS.