


Introduction
Introduction
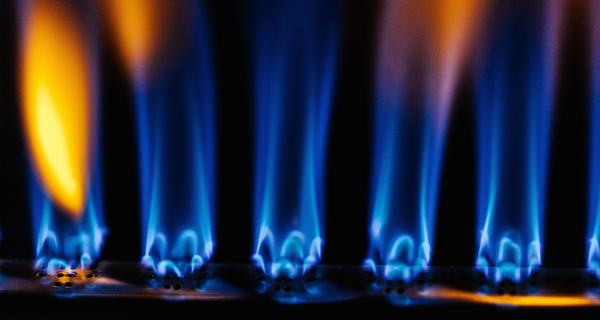
To meet its climate goals the UK needs to transition its homes to low-carbon heating by 2050. Heat pumps are widely expected to be the most common technology for low-carbon heating, and the UK Government aims to have 600,000 heat pumps installed annually by 2028. However, progress has been slow and the market is not currently growing fast enough to reach this target.
Cost is the most commonly cited barrier to getting a heat pump. For most homes, a first-time installation of an air-source heat pump is significantly more expensive than getting a replacement gas boiler [1]. Even with a £7,500 government subsidy, heat pumps cannot always compete on upfront costs [2]. A typical air-source heat pump costs around £12,000 to install (£4,500 after subsidy) compared to £1,500 to £2,300 for a typical gas boiler. Part of this reflects the cost of doing a first-time heat pump installation and making adjustments to home heating systems to accommodate a heat pump. While costs will be lower for replacement heat pump installations, the majority of heat pump installations over the next decade will be first-time installations and will carry these additional costs.
Alongside the upfront cost, heat pumps are not as cheap to run as they should be. They are extremely energy efficient; an air-source heat pump typically uses three to four times less energy than a gas boiler to produce the same amount of heat. But this efficiency premium is cancelled out by the high cost of electricity relative to gas. A unit of electricity in the UK is currently around 4.1 times more expensive than gas, one of the highest ratios in Europe. As a result, a household that switches to a heat pump is currently unlikely to save money on its energy bills. Ideally, heat pumps should have much lower running costs to offset the larger upfront cost.
If the UK is to stay on track to decarbonise home heating, heat pumps must become more affordable. Fortunately, there is considerable scope for policy action to bring down the overall relative costs of heat pumps.
The goal should be cost parity between heat pumps and gas boilers
We argue that governments in the UK should aim for cost parity between heat pumps and gas boilers in a typical home, and that this is achievable with the right policy changes. In our analysis, we focus on cost parity in terms of whole-life costs, combining upfront cost with running costs over the lifetime of a heat pump. We expect that most households will buy heat pumps using finance in future as the market scales up, which makes lifetime cost especially important. Achieving lifetime cost parity would mean that the monthly cost of heating a home with a heat pump – including paying for the installation – should be the same as with a gas boiler or lower.
There is considerable scope for innovation to reduce upfront costs, although we do not think that it is feasible to bring the first-time installation cost for a heat pump down to the level of a boiler in the near term. However, by combining action to reduce running costs with subsidies and affordable finance, our analysis suggests that the total cost of a heat pump for a typical household can become less than a gas boiler. Achieving this is critical both to making heat pumps affordable to all households and ensuring they can ease, rather than exacerbate, fuel poverty.
Governments in the UK will also need to grapple with the future trajectory of subsidies. Subsidies are currently helping to stimulate heat pump uptake, but may not remain affordable as the heat pump market scales up. If the number of heat pumps installed grows over time into the hundreds of thousands, the cost to governments will grow rapidly unless subsidies are reduced. But reducing the size of the subsidy risks stalling heat pump uptake, unless other measures are in place to reduce costs. Keeping subsidies affordable without reducing the incentives to get a heat pump will be a particularly acute challenge for governments in the late 2020s and 2030s.
Aims of this analysis
This analysis aims to explore how various factors affect the whole-life costs of heat pumps and boilers. We identified conditions that could lead to price parity between heat pumps and gas boilers over the next decade. We present three scenarios which demonstrate the trade-offs between policy choices and interactions with market and technological developments. These are compared to a baseline scenario in which no policy action is taken. The three scenarios are:
- A ‘High innovation’ scenario, in which upfront costs of heat pumps fall quickly and efficiency increases
- A ‘Cheaper electricity’ scenario, in which electricity costs fall more rapidly compared to gas
- A ‘High subsidy’ scenario, in which subsidies for heat pumps remain higher for longer.
Each of these scenarios gets heat pumps to, or close to, cost parity with gas boilers for most households over the next decade. The ‘High innovation’ scenario offers the largest advantage for the longest.
The scenarios involve varying five main factors that will influence the cost of a heat pump relative to a gas boiler:
- The upfront cost of installation.
- We have tested two different trajectories where upfront costs fall by 2.5% and 4.5% each year.
- The level of government subsidy.
- In all our scenarios the existing £7,500 subsidy remains until at least 2028 before gradually reducing at different rates.
- The cost of electricity relative to gas.
- A key factor in the cost of electricity and gas is the levies, which are currently higher on electricity than gas. All of our scenarios involve rebalancing the levies away from electricity and towards gas to different extents.
- The efficiency of the heat pump.
- Seasonal Coefficient of Performance (SCOP) is a measure of how much heat is produced by a heat pump for a unit of electricity used.
- The interest rate for financing a heat pump.
- Our analysis assumes all households will purchase heat pumps on finance, with 5% interest rates. Even where households do not use finance, the interest rate reflects the opportunity cost of not investing the money elsewhere.
The whole-life cost of each device in the scenarios is calculated by adding up the cost of installation and running costs and dividing them by 15 (the assumed lifespan of both heat pumps and boilers) to get the average annual cost. Our analysis includes interest rates, so is intended to approximate the full yearly cost a household would pay if buying a heating system on finance.
The resulting costs are presented separately for different types of homes. The price of a heat pump and a gas boiler varies depending on size requirements (determined largely by floor area); and larger homes use more energy for heating. We split homes into eight archetypes defined by built form and property age. These are 1) flats, 2) bungalows, 3) semi-detached, terraced houses and maisonettes, 4) detached houses; each divided into pre-1950 vs. post-1950 construction. We also present outcomes for an ‘average’ household, defined as the weighted average according to how these archetypes are represented in the English housing stock.
We do not think that there is a single way to make heat pumps affordable. Instead our analysis shows how different combinations of policy and market changes could lead to similar results for affordability. There are a number of unavoidable uncertainties in the analysis, particularly the path of future energy prices, which mean the results should be treated as an analysis of different policy measures rather than an accurate guide to future costs.
--------------------
[1] The ‘first install problem’ is a significant part of the cost challenge. While there are many homes that can install a heat pump with little or no other changes to their heating system, others may need upgrades. For example: new radiators and pipework or a hot water tank. Under-insulated homes are also a problem, but this is true for those using gas boilers too. Subsequent heat pump replacements will be much cheaper.
[2] The Boiler Upgrade Scheme (BUS) is available for England and Wales. Households in Scotland can access a £7,500 grant (£9,000 in rural areas) and an additional interest-free loan.
This report is part of our policy library for decarbonising home heating
Explore the library to learn moreA summary of our scenarios
A summary of our scenarios
Current cost situation – why policy action is needed
Heat pumps currently have significantly higher whole-life costs than gas boilers before any subsidy, because of the combination of higher upfront costs and similar running costs. However, households can currently receive £7,500 towards these costs through the Boiler Upgrade Scheme (BUS). After accounting for this subsidy, a typical household will currently pay a similar total amount for a heat pump as a boiler over its lifetime. Smaller homes, which typically require smaller heat pumps, benefit more from this than larger homes.
The BUS is only currently scheduled to run until 2028, after which point costs to consumers would rise substantially. This is shown in Figure 1, which represents our baseline scenario. Governments in the UK could continue subsidies after 2028, but this is unlikely to be affordable as the heat pump market scales up. Without policy action to reduce the costs of heat pumps, it would cost around £4.7bn per year over the next decade to maintain whole-life price parity through subsidies while matching the trajectory set out in the Sixth Carbon Budget. This is unlikely to be affordable. The government needs a plan for making heat pumps affordable that does not rely solely on subsidies.

Difference between median annualised whole-life cost of heat pump as gas boiler
Figure 1
This line graph illustrates the difference in median annualised whole-life costs between heat pumps and gas boilers from 2024 to 2035 under a baseline scenario, ie, with no policy changes. Negative numbers mean households save by switching to a heat pump. The chart plots costs for eight home archetypes: flats; bungalows; semi-detached, terraced houses and maisonettes; and detached houses, each split by construction age – before and after 1950. The average cost difference is depicted for each year of the heating being installed. Between 2024 and 2027, all archetypes pay up to £200 extra a year if they switch to a heat pump, with flats saving up to £150. There is a sharp increase in relative heat pump costs in 2028 when subsidies end – they range between £800 (detached houses) and £550 (flats). The relative costs gradually reduce to between £600 and £400 in 2035.
The scenarios
Our three scenarios represent potential ways of approaching cost parity between low-carbon heat and gas for a typical home. In each scenario, innovation, market development and governmental policies balance each other in different ways.
Figure 2 shows the difference in how much the average home would need to pay per year for a heat pump compared to a gas boiler in each scenario, depending on the year of installation. It shows that all three scenarios maintain the difference in the annualised cost between a heat pump and a gas boiler below £200 all the way to 2035.

Annual difference in whole-life cost between heat pump and gas boiler
Figure 2
This line graph shows the difference in annualised whole-life cost between heat pumps and gas boilers from 2024 to 2035 under four scenarios: Baseline, High innovation, Cheaper electricity, and High subsidy. The average cost difference is depicted under the four scenarios for each year the heating is installed. It ranges from -£400 to over £600. The Baseline scenario starts around break-even (0£ difference) and shows a steep increase to £670 in 2028 and then decreases slowly to £510. In contrast, all other scenarios begin with large savings (-£50 – -£230) and remain close to £0, crossing the break-even point in 2030. The maximum is £200 for Cheap electricity in 2034. The High subsidy scenario performs somewhat worse than the other two, with heat pumps becoming slightly more expensive in 2028 and remaining in positive values. Costs include installation and running costs, with negative values indicating savings from switching to a heat pump.

1. 'High innovation’ scenario
In the ‘High innovation’ scenario, heat pumps become both cheaper to purchase and cheaper to run thanks to a combination of increased efficiency and lower relative price of electricity. Levies on energy bills are partially rebalanced – to equalise the total levies paid on gas and electricity with typical consumption levels – which brings down the electricity-to-gas price ratio. Governments are able to scale down subsidies moderately quickly, ending them before 2034. This scenario leads to the biggest financial advantage for heat pumps, but relies on changes to the market price [3] and efficiency of heat pumps that are not entirely in the government’s power. Policies can and should aim to drive more innovation in the heating industry, but this cannot be relied on to deliver lower costs.
Heat pumps in an average home are cheaper over their lifetime for every year apart from 2034 and 2035 (essentially while some subsidy is available). The total cost of subsidies required under this scenario would be £16.1bn between 2025 and 2035, an average cost to governments of the UK of £1.5bn per year [4].
2. ‘Cheaper electricity’ scenario
The ‘Cheaper electricity’ scenario performs well on cost parity and has a limited cost to governments. It does, however, require significant action on electricity and gas prices. Levies are rebalanced so that each unit of gas and electricity carries the same total policy costs. This would not significantly affect households with typical gas and electricity consumption – the increase in gas levies would be offset by saving on electricity levies – but it would have distributional effects. Households that rely heavily on gas, which includes some fuel poor households, would be worse off under this proposal, and there is a strong case for compensating them. The change would be revenue-neutral for the government, although levies on gas would likely need to gradually increase as more households switch to electric heating. This scenario performs well on cost parity, similarly to the ‘High innovation’ scenario.
Heat pumps in an average home achieve cost parity or better until 2034. The total cost of subsidies required under this scenario would be £16.1bn between 2025 and 2035, an average cost to governments of the UK of £1.5bn per year.
3. ‘High subsidy’ scenario
The ‘High subsidy’ scenario represents a situation where neither the government nor the low-carbon heating industry makes enough progress on reducing installation costs and running costs. In this situation the government has to rely on higher subsidies for longer to maintain cost parity with boilers. This scenario performs least well on cost parity and has the highest cost to governments. As annual uptake of heat pumps rises, the total governmental spending on subsidies grows considerably each year.
This scenario performs slightly less well on cost parity. Heat pumps in an average home are slightly more expensive over their lifetime than a gas boiler from 2031 onwards. The total cost of subsidies required under this scenario would be £23.6bn between 2025 and 2035, with an average cost to governments of the UK of £2.1bn per year. This represents an additional cost of £680m per year compared to scenarios 1 and 2.
Table 1 includes details of all three scenarios.
Table 1: Summary of model scenarios
Table 2 summarises outcomes for the average household in the three scenarios in terms of relative annual costs for a heat pump compared to a gas boiler. (A positive value indicates that households save money by switching to a heat pump.) The ‘High innovation’ scenario and ‘Cheaper electricity’ scenario both manage to bring households close to price parity for substantially longer than what is expected in the baseline scenario.
Table 2
The price ratio between electricity and gas is critical. There is no realistic scenario that can achieve cost parity without reducing the ratio below 3.0 after 2025. To ensure that heat pumps are an attractive offer past 2028, the government has to either lower the electricity-to-gas price ratio further or maintain subsidies at the current high level for a long time. A lower than expected wholesale electricity price would not be sufficient to reduce the necessary ratio. A sharp increase in the market price of gas would have a much bigger effect, but would result in harmful impacts on households and the economy, which is why we have not included such a future in this analysis. Changes to the way policy levies are collected through bills are necessary for bringing electricity costs down and achieving whole-life price parity.
As a general rule, the more progress the government can make on reducing the electricity-to-gas price ratio and driving innovation in the industry, the less heat pumps need to be subsidised.
In the absence of subsidies – holding all our other assumptions constant – the relative costs of heat pumps for the average household would fall over time in all scenarios (Figure 3).

All scenarios, if no subsidies were available
Figure 3
This line graph shows the difference in annualised whole-life cost between heat pumps and gas boilers from 2024 to 2035 under four scenarios: Baseline, High innovation, Cheaper electricity, and High subsidy, if these scenarios included no subsidies. The average cost difference is shown for each year the heating is installed, with negative values indicating savings from switching to a heat pump. In 2024 the average household has the following additional annual costs for a heat pump compared to a gas boiler: £800 in the “Baseline” scenario, £680 in the “High subsidy” scenario, £620 in the “High Innovation” scenario and £490 in the “Cheaper electricity” scenario. These gradually decrease to £510, £370, £110 and £180 in 2035. Costs include both installation and running costs.
Table 3 shows how much governments of the UK would be required to spend on subsidies every year in each scenario. In the ‘Cheaper electricity’ and ‘High innovation’ scenarios subsidies are scaled down faster than in the ‘High subsidy’ scenario.
Table 3: Spending required by governments of the UK to cover subsidies that we assume in each model
We have assembled the scenarios to demonstrate how different factors can contribute to the affordability of heat pumps. They do not attempt to show the full range of possible policy and market developments, but rather to show the necessary and sufficient policies under different futures.
--------------------
[3] Although the Heat and Buildings Strategy (2021) cited a goal of cutting down heat pump costs by 25%–50% by 2025, costs have only come down by a marginal amount.
[4] Assuming that heat pump adoption follows the Balanced Pathway of the Climate Change Committee’s Sixth Carbon Budget – number of individual air-source and ground-source heat pumps and hybrids installed each year.
Scenario 1 – High innovation
Scenario 1 – High innovation
In the ‘High innovation’ scenario, the rate of innovation in the heating industry increases, making heat pumps both cheaper and more efficient. Heat pump installation costs fall rapidly, (by 4.5% per year instead of 2.5%) and they become more efficient – the average SCOP rising from 3 to 3.3 over time. There is a modest rebalancing of levies which leads to the electricity-to-gas price ratio to settle at 2.6. Subsidies are reduced gradually from 2028 onwards, and never exceed £2.4bn per year cost to governments.
Details of the scenario
Overall costs are driven down primarily by reductions in the market price for heat pumps. The cost of installing a heat pump falls by 28% by 2030 (from 2023 levels). Running costs fall due to higher heat pump efficiency enabled by technological improvements and increased quality of installations (requiring 3.8 times less energy to run a heat pump than a boiler by 2030). To further bring down running costs we equalised the total levy contributions on typical consumption [5] electricity and gas bills (to £97.80 annually) while keeping total levy revenue constant. The resulting per unit rates are 3.22p per kWh of electricity and 0.75p per kWh of gas, from 4.86p and 0.30p at the time of writing [6]. As electricity becomes cheaper and gas slightly more expensive, the price ratio reaches 2.6 (compared to 4.1 in 2024). The wholesale price of electricity and gas meanwhile follow the reference projections by DESNZ. Because both running costs and install cost both fall relatively steeply in this scenario, governments are able to reduce subsidies after 2028 while maintaining whole-life price parity. Heat pump subsidy is reduced to £5,000 in 2028, £3,750 in 2029, £2,500 in 2031 and finally zero in 2034.
In this scenario, it gets progressively cheaper for people to purchase heat pumps over boilers while subsidies remain high, but even after they are reduced most households are better off installing a heat pump all the way until 2034 when subsidies end (Figure 4).

Difference between median annualised whole-life cost of heat pump and gas boiler
Figure 4
This line graph illustrates the difference in median annualised whole-life costs between heat pumps and gas boilers from 2024 to 2035 under the “High innovation” scenario. Negative numbers mean households save by switching to a heat pump. The graph shows costs for eight home archetypes: flats; bungalows; semi-detached, terraced houses and maisonettes; and detached houses, each split by construction age – before and after 1950. The average cost difference is depicted for each year of the heating being installed. Cost difference starts between £0 and -£200 and further reduces. There are several increases in relative costs when subsidies are reduced: 2028, 2029, 2031 and 2034. Costs remain negative until 2034. They are generally very similar across archetypes, but detached houses pre-1950 save somewhat more on a heat pump (this is because they have higher running costs).
Figure 5 shows the costs for households switching to a heat pump in 2030. They would save on average between £60 and £150 a year depending on the type of home they have, with an average household saving around £60 per year (Figure 6).


--------------------
[5] Typical Domestic Consumption Values 2023: 2,700 kWh electricity and 11,500 kWh gas (Ofgem)
Scenario 2 – Cheaper electricity
Scenario 2 – Cheaper electricity
In the ‘Cheaper electricity’ scenario, price parity is driven by a rapid fall in the price of electricity relative to gas. The ratio of electricity to gas prices falls just below 2.0, driven by a more significant rebalancing of levies towards gas and a lower wholesale electricity price. Upfront heat pump costs fall by 2.5% a year, heat pump efficiencies stay constant, while subsidies follow the same path as in the ‘High innovation’ scenario, gradually decreasing after 2028.
Details of the scenario
The wholesale price of electricity follows lower price projections by DESNZ. But the majority of the difference is driven by a stronger rebalancing of policy levies than in other scenarios. The levies on bills are rebalanced so that a uniform cost of 1.29p per kWh is applied onto each unit of electricity and gas, while keeping the total amount of revenue collected constant. Households with typical gas and electricity consumption would now be paying most of their policy levies through gas (because more gas is used than electricity). This puts households that don’t use gas at a significant advantage. Meanwhile households with higher gas usage than the typical consumer will be slightly worse off. This rebalancing in combination with cheaper wholesale electricity leads to an electricity-to-gas price ratio of just below 2. This significantly reduces relative running costs of heat pumps. Compared to today (4.1), the ratio is considerably lower.
Similarly to the ‘High innovation’ scenario, here governments are able to reduce subsidies relatively early, with the same trajectory, and still keep the whole-life costs of heat pumps close to boilers. This is thanks to the extreme advantage of heat pumps in overall running costs.
Because gas becomes more expensive in this scenario, this creates large discrepancies in savings on heat pumps between archetypes. Most savings are due to the change in relative running costs, so heat pumps become particularly attractive for larger homes with higher energy usage.
Most households save on heat pumps until 2031 and remain around price parity until 2034 when subsidies end (Figure 7).

Difference between median annualised whole-life cost of heat pump and gas boiler
Figure 7
This line graph illustrates the difference in median annualised whole-life costs between heat pumps and gas boilers from 2024 to 2035 under the “Cheaper electricity” scenario. Negative numbers mean households save by switching to a heat pump. The graph shows costs for eight home archetypes: flats; bungalows; semi-detached, terraced houses and maisonettes; and detached houses, each split by construction age – before and after 1950. The average cost difference is depicted for each year of the heating being installed. Cost difference starts between £0 and -£200 and further reduces. There are several increases in relative costs when subsidies are reduced: 2028, 2029, 2031 and 2034. Costs remain negative until 2034. They are generally very similar across archetypes, but detached houses pre-1950 save significantly more on a heat pump (this is because they have higher running costs).
If installing a heat pump in 2030, households will save between £10 and £230 (£70 on average) on lifetime costs, depending on the type of their home, with larger homes saving more than flats (Figures 8 and 9).


Scenario 3 – High subsidy
Scenario 3 – High subsidy
In the ‘High subsidy’ scenario, neither the wholesale electricity price, nor heat pump efficiency or the heat pump market price change dramatically. This means that to keep heat pumps financially attractive past 2028, governments need to maintain a high level of subsidy. Subsidies for heat pumps are still reduced, but more slowly than in the first two scenarios, and they remain in place until 2035. The cost to governments of the UK goes up to a maximum of £3.2bn a year. The electricity-to-gas price ratio falls moderately, to 2.6, the same as in scenario 1.
Details of the scenario
As in the first ‘High innovation’ scenario, levies are partially rebalanced, to match the total amounts paid through gas and electricity at typical consumption. The resulting electricity-to-gas price ratio is again 2.6, but total relative running costs are higher because SCOP remains flat at 3. Upfront costs fall at a baseline annual rate of 2.5%.
If subsidies ended in 2028, the annual cost of a heat pump would become over £500 higher than the cost of a gas boiler in this scenario. To avoid this, the scenario employs a more generous trajectory for subsidies. They are reduced from £7,500 to £5,000 in 2028 and kept up for several years before reducing to £3,000 in 2031 and continuing until (at least) 2035.
Thanks to the subsidy, the lifetime cost to households is kept at parity with boilers until 2031 (Figure 10).

Difference between median annualised whole-life cost of heat pump and gas boiler
Figure 10
This line graph illustrates the difference in median annualised whole-life costs between heat pumps and gas boilers from 2024 to 2035 under the “High subsidy” scenario. Negative numbers mean households save by switching to a heat pump. The graph shows costs for eight home archetypes: flats; bungalows; semi-detached, terraced houses and maisonettes; and detached houses, each split by construction age – before and after 1950. The average cost difference is depicted for each year of the heating being installed. Cost difference starts between £70 and -£150 and then slowly reduces, but there are two sharp increases in relative costs when subsidies are reduced, in 2028 and 2031. The cost difference hovers close to zero between 2028 and 2030 and then is up between £200 and £50 in 2031–2035. The spread between different archetypes tends to be around £130, with larger properties benefiting more from a heat pump.
A household installing a heat pump in 2030 (and using the £5,000 subsidy) would on average pay the same amount over its lifetime for it compared to a gas boiler. Numbers for different archetypes range between paying £70 per year extra (large houses) and saving £50 per year (flats) on a heat pump (Figures 11 and 12). As subsidies are universal for all households and higher in this scenario, relative costs are much more similar across different home archetypes.


How much difference do the different factors make?
How much difference do the different factors make?
We have tested the factors that could make heat pumps relatively cheaper in the future, and it is clear that some have a disproportionate effect while others make only a marginal difference. Figure 13 illustrates how much each factor affects the difference between annual costs for a heat pump and a gas boiler. For consistency, these effects are measured relative to the ‘baseline’ scenario (ie, assuming no significant developments in all other factors), for a 2030 installation, with no government subsidies. The most influential factors are:
- A £5,000 heat pump subsidy
- Wholesale gas price
- Levy rebalancing (based on per-unit costs)
- 0% interest rates on heat pump loans.
In reality, factors are all highly interdependent. For example, changes to the relative prices of gas and electricity have a much stronger effect on price parity if absolute energy prices are higher, because running costs then make up a higher share of lifetime costs.
The varied effects of policies on the relative costs of heat pumps and boilers
Figure 13
This scatter plot illustrates how much various policy interventions and developments reduce the additional annual costs of a heat pump compared to a gas boiler. The cost changes are in reference to the baseline scenario, for an average household installing a heat pump in 2030 (ie., with no subsidy). Nine interventions are displayed, four of which affect upfront costs and five which affect running costs. The largest effects are seen for a £5,000 subsidy (£480), high wholesale gas prices (£450), levies rebalancing (by unit) (£300) and 0% loans (£290). Low wholesale electricity prices and increased SCOP have the smallest effect (<£100). The effect on different home archetypes is displayed separately along the average home. Large differences in impact between archetypes are seen especially in the case of low gas prices and levies rebalancing, with larger older properties benefitting more.
Rebalancing levies has the most significant effect on running costs
The relative electricity price has the largest impact on cost parity, as running costs account for approximately 60% of lifetime costs.
- Equalising levies on the basis of a typical home’s consumption (used in scenarios 1 and 3) reduces the difference in lifetime costs by £70 on average. This ranges from £190 (for a small home) to £260 (for a large home).
- Equalising the per-unit policy costs for both electricity and gas (used in scenario 2) reduces the difference in costs by £300 on average (£140–£560).
Changes in the wholesale prices of gas or electricity will affect the relative running costs of heat pumps and gas boilers. Changes in the gas price could have a significant effect, while changes in the wholesale price of electricity would have a small effect.
- Assuming DESNZ high price trajectory for gas shifts the relative running costs by £450 per year on average (£210–£820).
- Assuming the low price trajectory for electricity shifts the relative running costs by £30 per year on average (£10–£50).
This is because: i) gas prices are more uncertain so DESNZ projections have a much larger range between high and low scenarios; ii) wholesale costs are a slightly bigger share of household gas prices; and iii) more units of gas are used for heating than units of electricity.
Technological improvements in the efficiency of heat pumps add relatively small savings in our scenarios. The optimistic scenario in which average efficiency increases from 3.0 to 3.3 saves households on average £70 (range of £40–140) a year with reference electricity prices. The effect becomes even smaller with cheaper electricity. However, this reflects the relatively modest increases in efficiency we tested. Greater increases, such as raising the SCOP of a typical heat pump to 4.0, would have a larger impact.
Subsidies and loans will influence upfront costs more than general cost reductions
- We considered two options for how the market price of heat pumps might change, both based on our earlier analysis: How to reduce the cost of heat pumps. Our default assumption is that prices will fall by around 2.5% per year.
- If heat pump prices drop by 4.5% each year then the heat pump lifetime costs would fall by a further £130 on average, relative to the baseline scenario (£110–£160).
Government subsidies have a big impact on price parity, reducing the cost for all households by a flat amount. Adding a £5,000 subsidy (used in the ‘High subsidy’ scenario) lowers the annual cost of heat pumps for all households by £480 a year compared to baseline. This saving gets higher if interest rates rise, and lower if interest rates fall; the saving would be £333 per year at 0% interest rates.
The interest rates for heat pump finance also have a significant effect on the relative total costs. Heat pumps purchased either with cash, or with a 0% interest rate loan would be £290 per year cheaper on average (£240–£360) than those bought using the 5% rate loan used in our model. But when we deduct a subsidy (say £5,000), the effect of 0% interest rates is much smaller in absolute terms – £150 on average (£90–£210).
The interest rates on finance for any low-carbon heating measures will affect the total investment requirements of the heat transition. If we assume for simplicity that other types of low-carbon heating (heat networks, networked heat pumps, ground-source heat pumps) will have costs comparable to air-source heat pumps per household and assuming the baseline future price trajectory (2.5% annual drop), the total capital cost of investing in low-carbon heat between 2025 and 2035 could be around £100bn before any interest. Each one percentage point rise in the interest rate increases costs by roughly £9bn (Figure 14).
Total cost of low-carbon heat installations 2025-2035 under different interest rates
Figure 14
This chart depicts how the total cost of low-carbon heat installations from 2025 to 2035 would change under different interest rates. The total capex is based on targets set by the CCC's Sixth Carbon Budget and includes all low-carbon domestic heating excluding direct electric. Starting at £96bn at a 0% interest rate, the cost escalates progressively to £103bn at 1%, £111bn at 2%, continuing to increase through £120bn at 3%, £129bn at 4%, £138bn at 5%, £148bn at 6%, £157bn at 7%, £167bn at 8%, £178bn at 9%, and peaks at £188bn at a 10% interest rate. The trend line is a smooth, upward curve, illustrating the significant impact of rising interest rates on the total cost of installations.
The costs of installation vary between homes of a similar size and age
Throughout the analysis we have relied on a single cost of installation per home archetype. But in reality, heat pump prices vary substantially even within a single archetype. For example, the median installation cost for the most common archetype (semi-detached, terraced houses and maisonettes built post-1950) was £11,870 in 2023, but 20% of households in this archetype paid less than £9,800 while 20% of households paid more than £14,500. This largely reflects differences in what individual homes require to install a heat pump; particularly whether they need wider upgrades to their heating systems (including new radiators, hot water tanks or fabric insulation).
Considering how subtle the differences in costs between gas boilers and heat pumps are in our scenarios, it is important to note that even when the average home saves money on a heat pump, there will likely be a significant portion of homes that are either much better off or slightly worse off due to these variations in installation costs. Figure 15 shows one example of this effect, using our ‘High innovation’ scenario. While the majority of households in 2030 will save money installing a heat pump, those at the upper end of install cost requirements (roughly the top 30% of households in each archetype) may need to pay slightly more than for a gas boiler. Equally, a significant proportion of households will be significantly better off installing a heat pump.

Annualised whole-life costs of heat pumps by deciles compared to gas boiler
Figure 15
This bar chart shows the annualised whole-life costs of heat pumps by deciles, alongside a single bar for the costs of gas boilers. It zooms in on costs for a 2030 installation under the "High innovation" scenario for three selected archetypes: flats, semi-detached/terraced houses/maisonettes, and detached houses, all post-1950. For all archetypes, the three top cost deciles surpass the average cost of gas boilers, particularly noticeable in detached houses. Costs for each decile are divided into install costs and running costs. While the distribution of install costs of heat pumps is shown by deciles, we only use one mean figure for running costs. Although we expect that homes with larger heat pump requirements would also have higher heat demand – which would translate into higher gas boiler running costs –, we do not have accurate data to link installation cost distribution to heat demand distribution.
Conclusion
Conclusion
Affordability is a major barrier to large-scale adoption of heat pumps. This is why any plan for decarbonising heat needs to include a mix of policies to ensure that the typical household will be better off switching to a heat pump. The goal should be to reach cost parity over the whole lifetime of a heat pump while ensuring upfront costs are not a barrier.
The analysis in this paper shows that cost parity is achievable, in the short and long term, with the right policy action.
Key actions to take for price parity
Rebalance levies between electricity and gas
Our three scenarios show that it is crucial to bring the cost of electricity closer to the cost of gas, regardless of what happens to the heat pump market. The practical approach to do this is to rebalance the various levies which currently apply to electricity and gas bills. Currently, these cost consumers 4.9p for each kWh of electricity they use while the equivalent amount for gas is only 0.3p. This means that levies make up 17% of the total price of electricity, but only 6% of the price of gas. Even though the typical household (on gas) uses 4.3 times more gas than electricity (on a kWh basis), this typical household pays £142 a year via levies on electricity bills but only £46 on gas bills [7].
These levies fund a range of programmes (including the Energy Company Obligation) and removing them entirely from bills would cost governments around £5bn per year. We have proposed two options to rebalance the levies while ensuring that there is no shortfall in funding:
- Balance the levies so that gas and electricity raise the same amount based on consumption. Set unit costs to make the total levies paid through a gas and electricity bill equal for the typical consumer. For current typical consumption this would result in 3.2p paid per kWh of electricity and 0.8p per kWh of gas. This way, customers who use more electricity or less gas than defined in ‘typical consumption’ (ie, using a gas boiler and electrical appliances) would be winners overall, while those who rely more on gas with lower electricity consumption would be losers, compared to today. As more and more households switch to electric heating, this will lead to gradual reductions in the amounts of money collected overall, which might require levies to rise in future.
- Balance the levies so that gas and electricity have the same per-unit levy. In this scenario, a uniform levy of 1.3p per kWh applies to both electricity and gas, keeping the total levy revenue constant. This rebalancing would have impacts in the same direction as the first option, but would put electric households at an even bigger advantage, and may require larger adjustments in time to cover the same total amount collected.
We have not modelled the option of moving all policy levies from electricity to gas. This would magnify the advantage for households using electricity relative to gas seen in option b above. Implications of this option have been discussed, for example in analyses by Citizens Advice (2023) or E3G (2023).
Either of these rebalancing approaches would create strong financial incentives to switch to heat pumps and away from gas without creating any direct costs to the UK Government. In both approaches, but more sharply in the stronger option, a smaller number of households would gradually cover the majority of policy costs. While putting households on gas at a disadvantage, it would ensure a rapid and sustainable reduction in relative running costs of heat pumps. While rebalancing levies would be close to revenue neutral for the typical household, the UK Government should consider steps to compensate fuel poor households who lose out as a result of an increase in the price of gas.
The effect of levy rebalancing would be amplified by any increases in heat pump efficiency. In our analysis these potential efficiency gains reduce costs by less than £100 per year. However, much greater gains in efficiency, with SCOPs moving towards 4.0, would have a bigger impact. It is too soon yet to know whether this is achievable across all homes.
Consider a gas price floor
The price of fossil gas is by far the strongest factor in the overall cost difference between high-carbon and low-carbon heating. While higher prices for fossil gas will favour low-carbon heating, sustained low prices would pose a big problem. This would both increase the electricity-to-gas price ratio and make it harder for lower running costs to offset the upfront costs of a heat pump. Setting a minimum price for gas is one way to mitigate against this outcome.
The Government could set a floor around 4p or 5p per kWh on the household gas price. This could fall over time as the electricity price is increasingly decoupled from the gas price.
Plan for heat pump subsidies past 2028
Our scenarios show that even with action on electricity and gas prices some level of subsidy for heat pumps is likely to be needed into the 2030s. The UK Government must have a plan for continuing subsidies beyond the current end date for the BUS (in 2028). It also needs to estimate how much these subsidies will cost as heat pump uptake ramps up in the early 2030s.
The number of grants available each year needs to rise in line with demand, to provide an ongoing incentive to a growing number of households. However, to prevent costs spiralling, the size of individual grants will need to be stepped down gradually over time. Our analysis shows that more modest subsidies (of £3,750) in 2030 would still support cost parity for the typical household, as long as other measures to reduce running costs have also been taken.
Given the variation in costs between households, there may be a case for the government to consider additional subsidies for homes that require more remedial work before installing low-carbon heating. This could be part of the main subsidy scheme, or part of a separate ‘heat pump ready’ subsidy scheme.
There is also a strong case for fully funding low-carbon heating installations in fuel poor homes, as well as social housing. The Energy Company Obligation scheme currently installs heat pumps in some fuel poor homes, although this would need to scale up significantly to cover all fuel poor homes. The costs of fully funding low-carbon heating in all fuel poor homes are likely to be significant.
Ensure low-cost finance options are widely available
Even if heat pumps and gas boilers cost the same over their lifetime, heat pumps will remain considerably more expensive upfront. Most households cannot afford a heat pump out of pocket. As such we expect most heat pumps to be purchased using some form of finance. A key action for policymakers is to ensure that low-cost finance is widely available to help households do this.
Across all three scenarios we have assumed that heat pumps are bought using finance and the costs are spread over the lifetime of the unit at a flat annual rate of 5%. This roughly reflects current mortgage rates rather than other forms of consumer finance, such as personal loans or car finance. Governments in the UK may be able to use various forms of support, including guarantees, to reduce the interest rate paid by households to purchase heat pumps. This type of intervention would have a significant positive impact on the lifetime cost of a heat pump.
Governments in the UK may also consider offering low-cost retrofit loans, either at government borrowing costs or with zero interest. Zero interest loans would require a governmental subsidy, which would vary depending on market interest rates.
Achieving cost parity between heat pumps and gas boilers is not straightforward, but with the right policy action it is achievable. Applying the right mix of policies to create incentives over the course of the next 10 years should ensure that in 2035 close to half of all homes will have low-carbon heating. This should lay the ground for phasing out new boiler installations after 2035, to meet the UK’s net zero goals.
--------------------
[7] 2,700 kWh electricity and 11,500 kWh gas
Assumptions and methods
Assumptions and methods
Installation costs
The costs of heat pumps used in this report are derived from data from the Microgeneration Certification Scheme (MCS) Installations Database.
- We used data from MCS-certified air-source heat pump installations into properties in England, Scotland, and Wales (between January 2021 to mid-2023) where we could match an Energy Performance Certificate (EPC) [8].
- Costs have been adjusted for inflation to the 2023 equivalent using the Consumer Price Index.
- Costs include the unit price, materials and labour for installation, and may include any associated necessary upgrades to heating systems (such as hot water tanks, new radiators, pipework), including VAT [9]. They do not include any simultaneous insulation works.
- Median costs for some of the archetypes are approximately: £9,700 for flats, £12,000 for semi-detached and terraced houses, and £14,000 for detached houses.
Future heat pump prices depend on how demand changes and how the market develops. We consider two options for price development – a baseline option with a stable annual price decrease of 2.5% and an optimistic option with a 4.5% annual reduction (corresponding to a drop by 26% and 42% in 2035 from 2023, respectively). These match the ‘optimistic’ and ‘moderate’ scenarios we developed using experience and learning rates in our previous work. This means that in the baseline scenario the price of a heat pump for an average home goes down to about £10,000 by 2030.
We assumed flat installation prices for gas boilers for the next 10 years: £1,550 for flats, £1,860 for medium-sized homes, and £2,270 for detached houses. These estimates are based on BEIS (2017), Delta-ee for BEIS (2018), and our own market research and adjusted to 2023 prices using Consumer Price Inflation index 05.3.
The analysis is conducted in 2023 prices, which means that future inflation is not taken into account, apart from on energy prices.
Subsidies
The actual upfront costs of a heat pump that fall on households are hugely influenced by the level of governmental subsidies. We consider two options:
- Subsidies are reduced gradually until 2033
- Subsidies are reduced several times, but stay relatively high at £3,000 throughout – until 2035.
In both options we assume the current grant scheme (BUS) to remain at £7,500 until 2028 as planned. Our model does not account for the effect that the level of subsidy can have on uptake when estimating future costs of subsidising heat pumps. We also assume that all households who install a heat pump use the subsidy available.
Finance
Even with subsidies, the remaining upfront cost required is still a significant burden for most households. We expect that homeowners will use finance to purchase a heat pump in the future. Defining a market interest rate for heat pump finance is difficult, and is also a potential area where governments can take policy action. The March 2024 OBR forecast has the long-term Bank of England interest rate at 3.2%, so we have used a flat rate of 5% for all heat pump purchases to represent a small mark-up over this rate. In reality, this rate could be much higher (especially if heat pumps are seen as a high-risk investment) or lower with government policy action.
Running costs
Annual running costs for heating are determined by the unit prices of electricity and gas and energy demand.
Energy prices
After the peak of the energy crisis, the price of electricity has come down in both absolute terms and relatively compared to gas, but it is still about 4.1x higher per unit than gas. Consumer prices of electricity and gas have several components including: the wholesale price of energy, network and operating costs, and additional policy-specific levies. These policy costs currently account for 17% of the unit price for electricity, but only 6% of the gas price. Our model uses wholesale electricity and gas price projections by DESNZ (Figure 16), keeping prices constant after 2031 [10]. DESNZ expects electricity prices to fall more sharply than gas in the next five years, which would narrow the price gap. However, energy price forecasts are extremely uncertain, especially since the 2022 energy crisis, so there is significant scope for error here. In our scenarios we use two options for the wholesale electricity price (reference option and low-price option) in conjunction with varying future green levies.

Wholesale energy price projections used in our model
Figure 16
This line graph shows the projections used in the model for wholesale energy prices between 2025 and 2050. Three lines represent two different projections for electricity (reference used in Scenarios 1 and 3 and low used in Scenario 2) and one reference projection for gas. The reference and low electricity prices start around 10 and 7 p/kWh, respectively. They decrease gradually to 4.4 and 3.7 p/kWh in 2030. Gas prices remain relatively flat, from 3.9 to 2.5 p/kWh. The model indicates with a dotted line that we have replaced DESNZ projections with flat prices from 2031 onward.
We consider two options for changing electricity and gas levies, assuming that any changes are put in place from 2026 onwards:
- Levies are rebalanced to equalise per-unit costs on both electricity and gas while keeping the total levies paid by a typical consumer constant.
- Levies are rebalanced to make the total amount paid through gas and electricity by the typical consumer equal.
For the purposes of this analysis, we assume that households switching to a heat pump will disconnect from the gas grid and stop paying a standing charge for gas.
- Our model does not consider the additional costs of switching from gas to induction hobs for cooking.
- Our model does not consider any per-household costs of disconnecting from the gas grid.
- We do not include any annual increase in levies or other costs (network, operating costs); our analysis uses the April–June 2024 levels at a flat level until 2050.
- We keep gas standing charges constant at current levels. It is likely that these will increase in future, particularly if the number of properties using gas is reduced.
Energy demand
Heat demand for each home archetype is derived from heat demand estimates in the MCS Installations Database. This covers properties in England, Scotland, and Wales that had an MCS-certified installation of an air-source heat pump between January 2021 and mid-2023 and that we could match an EPC record to. Heat demand is largely determined by the age of a property (older properties having lower thermal efficiency) and then also its size (larger properties require more energy). Heat demand levels for some of our archetypes are: 5,800 kWh for flats, 11,600 kWh for semi-detached and terraced houses, and 18,300 kWh for detached houses.
We assume that heat pumps have a coefficient of performance of 3 (baseline) which can increase over time to 3.3 (optimistic scenario). Gas boiler efficiency is set to 0.85. This means that gas boilers use approximately more than 3.5x more energy to produce one unit of heat (baseline).
We assume in this model a home with a heat pump will require the same amount of heat as one with a gas boiler. There is some evidence to suggest that some heat pump users may have higher heat demand relative to gas boiler users, because heat pumps work more effectively when running constantly. However, we have used the same heat demand for both heat pumps and gas boilers here as: i) there is limited real-world evidence on this effect at this stage; and ii) there is a risk that our analysis would no longer be a like-for-like comparison because heat pump users are using more heat.
Other assumptions and methodology notes
- We focus here on the relative costs of air-source heat pumps as they are the most common low-carbon solution. We expect shared ground loops, heat networks and other technologies will need to hit similar cost levels to be competitive.
- Our analysis hasn't factored in the impact of time of use tariffs, nor of combining home solar panels or batteries with heat pumps. This has scope to reduce running costs for heat pumps significantly, but is hard to predict.
- Running costs also include total maintenance costs over 15 years – £750 for a heat pump and £1,200 for a gas boiler. Different maintenance costs could quite significantly affect price parity.
--------------------
[8] The combined dataset used for the analysis consists of information from over 50,000 installations.
[9] We have previously described what determines the cost of a heat pump in more detail in ‘How to reduce the cost of heat pumps’, 2022.
[10] DESNZ: Energy and emissions projections: 2022 to 2040


