About Nesta
We are Nesta, the UK's innovation agency for social good. We design, test and scale solutions to society's biggest problems. Our three missions are to give every child a fair start, help people live healthy lives and create a sustainable future where the economy works for both people and the planet.
For over 20 years, we have worked to support, encourage and inspire innovation. We work in three roles: as an innovation partner working with frontline organisations to design and test new solutions, as a venture builder supporting new and early stage businesses and as a system shaper creating the conditions for innovation. Harnessing the rigour of science and the creativity of design, we work relentlessly to change millions of lives for the better.
Find out more at nesta.org.uk
If you'd like this publication in an alternative format such as Braille or large print please contact us at [email protected]
Authors
Laura Jones
Fionnuala O'Reilly
India Kerle
Jack Vines
Executive summary
Early-years professionals (EYPs) make a difference to the lives of many children, setting them on a path to thrive socially and academically. Yet in settings throughout England, EYPs are stretched beyond capacity. This is partly due to significant challenges in recruiting and retaining staff at all levels.
The expansion of childcare entitlements announced in the UK Government's spring budget 2023 will be welcomed by many families across England. From September 2025 working parents of children aged nine months+ will have access to 30 hours per week of funded Early Childhood Education and Care (ECEC) in term time (henceforth referred to as the ‘new entitlement').
However, from a supply perspective, the new entitlement places further burden on an already over-extended workforce. More than 7 in 10 local authorities report that ECEC settings are finding it 'very difficult' to recruit staff with the required qualifications and experience. Over the course of the pandemic, EYP numbers in England dropped sharply, and have yet to recover to pre-pandemic levels.
The aim of this research is to estimate how many EYPs are required to meet the expansion of childcare hours announced by the Chancellor in March this year. We separate our analysis into two parts. First, we describe the modelling used to estimate future demand for EYPs. Second, we explore current pressures on the sector more broadly, which could make the implementation of the new entitlement challenging.
Section 1: introduction
Section one of this report provides the context for the research. The expansion of government-funded entitlement of early years' provision will considerably reduce costs for eligible families. However, it places a significant burden on a sector that is already struggling to recruit and retain staff.
Section 2: modelling the future demands of the sector
In section two, we detail the modelling undertaken to estimate how the new entitlement is likely to influence demand for EYPs by 2028, when the Office for Budgetary Responsibility (OBR) estimates that its impact on parental working patterns will be realised. We attempt to answer four questions throughout this section.
1. How many children will be eligible for the new entitlement?
We use data from the UK Household Longitudinal survey to calculate the proportion of one and two year olds who are likely to be eligible based on their parents' current working patterns. We find that 45% of one year olds and 51% of two year olds live in households that would currently be eligible. The OBR expects the new policy to raise employment by 60,000 by 2028, increasing the number of eligible children. Using these figures and population projections from the ONS, we estimate 285,000 one year olds and 323,000 two year olds will be eligible for the entitlement by 2028.
2. How much childcare do families currently use, and how is this likely to change in response to the new entitlement?
ECEC usage differs substantially along two key criteria: child age (older children use more ECEC) and parental working status (those in families that will be eligible for the new entitlement, hereafter 'working families', use more ECEC than those who will not be eligible, hereafter 'non-working families'). Currently, one year olds living in working families use 12 hours of formal childcare a week, compared to 15 hours for two year olds and 22 hours for three year olds. By contrast, children in non-working families use only one hour per week for one year olds, six hours for two year olds and 13 hours for three year olds.
As parents' response to the new entitlement is inherently uncertain, we model the impact of the new entitlement on hours spent in ECEC under a high, low and most likely scenario These help illustrate the importance of take-up rates in driving the demand for EYPs. In our most likely scenario we assume that ECEC hours of one and two year olds in working families are sensitive to free entitlements in the same way that those of three year olds were historically. Therefore, we assume that ECEC usage will grow by the same percentage as that of three year olds following the introduction of the universal 15 hour entitlement, and later the 30 hour entitlement for working families. Under this scenario, total hours in ECEC would rise by 46% for one year olds and 33% for two year olds compared to 2023 levels. This is driven by an increase in hours among children in working families, and a shift in working patterns among families with at least one non-working parent in response to the policy.
We use the staff:child ratios set out in the Statutory Framework for the Early Years Foundation stage to calculate the total full-time equivalent (FTE) workforce required to deliver the additional hours under each scenario. As the Chancellor announced a relaxation of child:staff ratios for two year olds in the spring budget, we use both the current and relaxed ratios in our calculations.
Under the most likely scenario, between 24,851 and 27,583 EYPs will be needed by 2028 to deliver the expected increase in ECEC hours. This represents 7-8% of the current total workforce, but a much larger proportion (34-38%) of the current 0-2 year old workforce, which the IFS estimated to be 73,000 in 2023 (Drayton et al, 2023).
Workforce requirements could be substantially larger, as the perfect allocation of additional staff to hours implied by our analysis is unlikely to happen. Conversely, the projected fall in the number of three and four year olds will free up some capacity within the sector, but because ratios of professionals to children are much lower for the over threes (1:8 or 1:13 if the staff member has a level 6 qualification), than they are for the under threes (1:3 for the under twos and 1:4 for two year olds), this demographic change will likely not outweigh the increases in demand from the introduction of the new entitlement.
4. Where, and among whom, will demand rise the most?
While we expect demand for ECEC to rise overall, it will not be evenly distributed, either geographically or socioeconomically. As eligibility for the new entitlement is the same as eligibility for the existing three and four year old entitlement, we examine usage patterns to get a sense of likely regional variation in demand, as well as how the policy might influence ECEC usage across families with different household incomes. We find that (i) entitlement uptake will be highest in areas of low deprivation and lowest in urban areas of high deprivation, and (ii) ECEC usage will likely increase overall, but least among the most low income families.
Section 3: current pressures on the sector
In section 3, we examine current pressures on the early-years (EY) sector, focusing on staff qualifications, pay and the ability of providers to offer the free entitlements.
- Staff qualifications among those providing free entitlements are declining. Any expansion of provision is likely to come primarily via the private, voluntary and independent (PVI) sector, where the qualification levels of those providing free entitlements are low and falling. Over the past three years there has been a drop in the number of staff with either a graduate or level 3 (A-level equivalent) qualification, delivering funded entitlements in PVI providers. This comes alongside a two percent decrease in the number of staff delivering the entitlements overall.
- Pay of EYPs is more comparable with those working in retail than other education professionals. We analysed salaries in the EY sector using a novel dataset - Nesta's Open Jobs Observatory – which consists of millions of job postings scraped from an online aggregator site collected between January 2021 and March 2023. We then compared salaries in the EY sector to those in comparator professions, chosen because they require similar skills, or are frequent destinations for leavers of the sector. We found that despite substantial crossover in required skills, EYPs trail other education professionals (such as primary school teachers) in terms of pay. Median salaries for EYPs are approximately £22,500-£25,000, compared to £31,500-£45,500 for primary and secondary teachers. EYP salaries are more comparable to that of retail assistants (£22,000-£23,500) and waiters (£23,000-£26,000).
- The number of providers offering free entitlements is falling. Over the past three years, the number of providers of any type offering the free entitlements has declined every year. Compared with 2020, there are now six percent fewer providers delivering the universal 15-hour entitlement and four percent fewer delivering the working 30-hour entitlement. This is driven by a reduction in both private and voluntary providers as well as childminders offering the entitlements. It is only partially offset by a small rise in state-funded settings, which account for a much smaller proportion of provision overall. The decline is not equally distributed across the country. Derbyshire has seen a 38% reduction in the number of private and voluntary providers delivering the working 30-hour or universal 15-hour entitlements since 2020, while Greenwich has seen a 19% increase.
Section 4: conclusion
By 2028, when the new entitlement is fully operational, ECEC usage will rise by 46% for one year olds and 33% for two year olds compared to current levels. To meet this demand, the sector needs between 25,000 and 27,500 EYPs; seven to eight percent of the current workforce. This is a conservative estimate as it supposes the perfect allocation of additional hours to staff, which is unlikely. As it stands, the sector would struggle to absorb this additional demand: the number of staff has fallen by three percent since 2019. Low pay, limited career progress and perceived low status all make attracting and retaining existing staff challenging.
Our next piece in this series on ECEC explores where future governments should invest to make the EY sector more sustainable. We examine the balance of increasing parents' resources by spending on parental leave and welfare benefits, versus the need to build strong and lasting public services to ensure every child, regardless of their postcode, has the best possible start in life.
Introduction
For many parents, childcare is prohibitively expensive: more than half of families using childcare for their one-year old spend more than £90 a week, and a quarter of parents of one or two year olds find it difficult to afford costs (Farquharson and Olorenshaw, 2022).
In response to this, and in the face of growing calls to ease financial pressure on parents, the UK Chancellor announced that, from September 2025, working parents of children aged nine months+ in England will have access to 30 hours per week of funded early childcare and care (ECEC) in term time (henceforth referred to as the 'new entitlement'). This represents a significant expansion of government funded-entitlement of early-years (EY) provision and will considerably reduce costs for eligible families.
While many families will welcome the Chancellor's announcement, it will be challenging to deliver. The planned expansion of the sector comes against the backdrop of a chronic crisis in recruitment and retention which is threatening the stability of providers. Seventy-one percent of local authorities report that local childcare settings are finding it 'very difficult' to recruit staff with the required qualifications and experience (Jarvie et al, 2023). Over the course of the pandemic, EY staff numbers in England dropped sharply, and have yet to recover to pre-covid levels. Sixty-nine percent of local authorities report that staff shortages make sustainable childcare provision in their areas very difficult (Coram Family and Childcare, 2023).
Working parents of children aged three plus already qualify for 30 hours per week of funded ECEC, so the new entitlement will reduce costs and raise demand for ECEC among parents of under-threes. Childcare supply is already particularly tight for younger children; only 50% of English local authorities are confident there are sufficient places across all areas for children under two, a drop of seven percentage points since 2022. By comparison, 73% are confident they have sufficient places to provide the 15-hour entitlement to three and four year olds (Jarvie et al, 2023).
Quality, and not just quantity, of ECEC provision is important. A large body of evidence shows that ECEC can have a positive impact on children's social and educational development, but only if it is of high quality. Offering high-quality early education relies on having a strong and well qualified workforce. But, since 2020, an increasing proportion of staff delivering funded entitlements have no EY qualifications, raising questions about how the standard of provision can be maintained as providers increase the number of places to meet the potential demand the new entitlement may bring.
The aims of this research are twofold. Firstly, to estimate how many EYPs will be required to meet the expansion of childcare hours announced by the Chancellor in March 2023. Secondly, to examine current pressures on the sector, demonstrating how these are likely to be impacted by introduction of the new entitlement.
The structure of this report is: after a brief overview of the policy landscape (section 1.1) we assess the demands on the sector this new entitlement is likely to create by 2028, when the Office for Budget Responsibility (OBR) expects its impacts will be realised (section 2). We begin by asking how many children will be eligible for the new entitlement (2.1) before developing assumptions around how childcare usage is likely to change in response to it (2.2) and calculating how many EY professionals will be needed to respond to that demand (2.3). Finally, we ask where, and among whom, demand is likely to rise the most, focusing on differences by local area and income (2.4). This required expansion comes against the backdrop of substantial existing pressures on the sector, which we analyse in section 3, focusing on qualification levels (3.1) and pay (3.2) of EYPs, and the scale of current provision (3.3.)
1.1 Current and future early education entitlements in England
Funded hours in ECEC are currently available via three different ‘free' entitlements, which differ in terms of the age groups targeted, eligibility requirements and number of hours offered.
- The disadvantaged two year old offer provides the most disadvantaged two year olds with 15 hours of ECEC for 38 weeks per year. Eligibility is based on receipt of certain benefits.
- The universal three to four year old entitlement offers all three and four year olds 15 hours of ECEC for 38 weeks a year.
- The working three to four year old entitlement offers an additional 15 hours per week, 38 weeks per year of ECEC to three and four year olds in families where both parents, or the single parent, are working and earning the equivalent of at least 16 hours a week at minimum wage, and neither parent has a taxable income over £100k (hereafter ‘working families').
Introduced over successive administrations, the existing entitlements broadly have two aims, which are reflected in their differing eligibility requirements. First, to support parents into paid work; and second, to facilitate access to ECEC for children from disadvantaged families. Targeted at parents in working families, the new entitlement announced in the March 2023 budget was introduced in support of the first of those aims. It fills the current gap in support that many families have between the end of maternity leave and age three when they become eligible for funded ECEC.
- The new working entitlement offers 30 hours per week of ECEC, 38 weeks a year, for children aged nine months to two years in working families.
The new entitlement will be introduced in phases between April 2024 and September 2025. As it is targeted at working families it represents a distinct change in focus compared to existing provision for under threes. At present, the only children under three years of age who benefit from government-funded childcare hours are the approximately 40% most disadvantaged two year olds who qualify for 15 hours per week of ECEC. Table 1 summarises existing childcare offers as well as the new offer.
Table 1: summary of current and future early education entitlements in England
| Name |
When introduced? |
Who? |
How much |
Eligibility requirements |
| The disadvantaged 2 year old entitlement |
First introduced in 2009, in current form since 2014. |
Disadvantaged 2 year olds |
15 hours, 38 weeks of the year |
Approximately 40% of most disadvantaged 2 year olds. Eligible if their parents receive a qualifying benefit (such as Income support, Jobseeker's Allowance), or if the 2 year old is looked after by the local authority, has an education, health and care plan, gets Disability Living Allowance, has left care under an adoption order, special guardianship |
| The universal 3-4 year old entitlement |
First introduced for 4 year olds in 1998 and 3 year olds in 2004. |
All 3 and 4 year olds |
15 hours, 38 weeks of the year |
Universal |
| The 3-4 year old working entitlement |
2017 |
3 and 4 year olds with working parents |
An additional 15 hours, 38 weeks of the year. |
Working parents - families are eligible if both parents, or the single parent, are working and earning at least the equivalent of 16 hours a week at minimum wage. Neither partner must earn more than £100,000. |
| The new working entitlement |
To be introduced in stages between 2024 and 2025 |
9 months to 2 years |
30 hours, 38 weeks of the year |
|
Terminology and acronyms used in this report
- ECEC - early childhood education and care
- EY - early years
- EYP - early-years professional
- PVI - private, voluntary and independent
Working families / non-working families
For clarity, throughout this report we use the term 'working families' to refer to families who are, or will be, eligible for the two early education entitlements targeted at working parents: the existing three to four year old working entitlement and the new entitlement for children aged nine months to two years. Conversely, we use the term non-working families to refer to families who would not be eligible for these offers. That is, families in which at least one parent is not working, or earning an insufficient wage. These are shorthands and we acknowledge that they may not fully capture the reality for some families.
1. Modelling the future demands of the sector
Expanding the funded childcare hours to children aged two and under in working families (the new entitlement) will substantially reduce the cost of childcare. It will save the average family with a toddler over £80 a week, and substantially more for some (Drayton et al, 2023). This is likely to lead to an increase in demand for ECEC, and therefore for EYPs, to deliver it.
In this section we estimate how the new entitlement is likely to influence the demand for EYPs by 2028. We choose 2028 as this is the time frame by which the OBR estimates that this policy will raise employment by 60,000, as well as increasing the hours of parents already in work.
To understand this we first estimate the size of the eligible population, then model how demand for childcare is likely to rise under three take-up scenarios: high, most likely and low. Finally, we calculate the number of EYPs needed to meet additional demand in each scenario. Throughout this section we document the choices and assumptions underlying our models. As we are interested in the impact of the new entitlement we limit our focus to demand among under threes. However, we consider the implications of demographic shifts in the number of three and four year olds between now and 2028 to our findings in section 2.3.
It is important to note that, while children will become eligible for the new entitlement in the term after they turn nine months old, our analysis throughout applies only to children aged one and two. This is because we do not have the relevant fine-grained information on age in months in any of the datasets we use. Our final figures therefore are conservative estimates in that they do not account for this group. However, this is mitigated by the fact that eligibility is calculated on a termly basis; a child who turns nine months on 1 September would only be able to start claiming their free hours from 1 January at the earliest, when they would be over one year old.
2.1 How many children will be eligible for the new entitlement?
We estimate that 285,000 one year olds and 323,000 two year olds will be eligible for the entitlement by 2028.
To estimate the number of children who will be eligible for the new entitlement we need to know the following information:
- The number of eligible children based on their parents' current working patterns; and
- The number of children likely to become eligible due to changes in their parents' working patterns in response to the introduction of the policy.
To estimate the proportion of one and two year olds who are likely to be eligible based on their parent's current working patterns, we use the UK Household Longitudinal Survey, which contains information on hours, earnings, benefits and proxies for immigration status for UK households. Using this information, we estimate that 45% of one year olds and 51% of two year olds in England live in eligible households.
To estimate the number of children who will become eligible due to changes in their parents' working patterns, we use estimates from the Office of Budget Responsibility (OBR) that by 2027-2028 this policy will raise employment by 60,000 (OBR, 2023). We assume that each person entering employment has one child between the ages of one and two, with an equal number of one and two year olds, as labour market participation rates of mothers of one and two year olds are similar (ONS, 2021b), and the ratio of one to two year olds in the population is fairly equal year on year (ONS, 2023a).
Using these figures and ONS population estimates for 2028, we arrive at a final figure for the number of eligible children by 2028.
Table 2: numbers of one and two year olds eligible for the new entitlement by 2028
| Age |
Total |
Number eligible |
Number non-eligible |
| 1 |
567679 |
285456 |
282223 |
| 2 |
574982 |
323241 |
251741 |
Source: authors' calculations using the UK Household Longitudinal Survey and ONS (2023a)
2.2 How much childcare do families currently use, and how is this likely to change in response to the new entitlement?
We estimate that the number of hours spent in ECEC will rise by 46% (one year olds) and 33% (two year olds) by 2028
The next step in understanding any potential future workforce shortfall is to develop assumptions around how hours in ECEC among eligible children are likely to change following the introduction of the policy. This involves understanding how much ECEC the soon-to-be eligible families currently use, and how that demand might change if costs are reduced. Because this second point is inherently uncertain, we calculate increases in hours under a high, most likely and low take-up scenario.
Figure 1 shows how much ECEC children aged 0-3 currently use, based on data from the Childcare and Early Years Survey of Parents. We distinguish between families who will be eligible for the new entitlement – ‘working families' – and those who will not be, who we term ‘non-working families' as a shorthand.
It is clear from figure 1 that ECEC usage differs substantially along two key criteria: child age (older children use more ECEC) and parental working status (those in working families use more ECEC than those in non-working families). On average, one year olds living in working families use 12 hours of formal childcare a week, compared to 15 hours for two year olds and 22 hours for three year olds. By contrast, children in non-working families use much less ECEC: one hour per week for one year olds, rising to 13 hours for three year olds.
2.3 How many EYPs will be needed to deliver the extra hours?
We estimate that between 25,000 and 27,500 EYPs will be needed to deliver the additional hours following the introduction of the new entitlement.
Early-years providers are required to adhere to the staff:child ratios set out in the Statutory Framework for the Early Years Foundation stage. Until September 2023 these required EY providers to have one adult for every three children under two years old and one adult for every four children aged two to three. However, following a change announced in the spring budget, since September 2023 there has been a relaxation of the two year old ratios to 1:5. As we discuss in more detail later, it is unclear to what extent providers will implement the new ratios. We therefore calculate the additional workforce requirements using both the current and relaxed ratios.
We calculate the total full-time equivalent (FTE) workforce required to deliver the additional hours under each scenario as
- two year olds: 40 staff hours/week allocated to four children (current ratios)
- two year olds: 40 staff hours/week allocated to five children (relaxed ratios)
- one year olds: 40 staff hours/week allocated to three children.
It is important to note that this assumes a perfect allocation of staff to additional hours and therefore a very conservative estimate of the workforce required to deliver the estimated hours. We apply the relaxed ratios only to additional (and not all existing) two year old hours, but discuss in the final paragraph in this section how implementing this policy across the whole system might influence the availability of EYPs.
Table 3 shows the final results of this process after summing the number of staff required across both one and two year olds.
| Scenario |
Current ratios Total FTE WF needed for increased hours |
% increase compared to 2022 EY workforce |
Relaxed ratios Total FTE WF needed for increased hours |
% Increase compared to 2022 EY workforce |
| Most likely |
27583 |
8 |
24851 |
7 |
| High |
40051 |
12 |
37114 |
11 |
| Low |
12062 |
4 |
10930 |
3 |
Table notes: percentage increase compared to the 2022 EY workforce is based on an estimate of 334,400 staff delivering early years provision in 2022 (DfE, 2022).
Under the most plausible scenario, between 24,851 and 27,583 EYPs will be needed by 2028 to deliver the expected increase in formal childcare hours following the introduction of the new entitlement. This represents 7-8% of the current total workforce, but a much larger proportion (34-38%) of the current 0-2 year old workforce, which the IFS estimated to be 73,000 in 2023 (Drayton et al, 2023). Workforce requirements could be substantially larger, as the perfect allocation of additional staff to hours implied by our analysis is unlikely to happen.
As the results from our high and low take-up scenarios demonstrate, there is considerable uncertainty around these estimates. The EY workforce could need as few as 12,000 additional staff by 2028, or as many as 40,000 depending on how demand for childcare is influenced by the new policy. To put this into context, the sector lost 15,000 staff between 2019 and 2021 and had only regained 6,000 of that number by 2022.
Table 4: number of paid childcare provider staff in England
| | Number of staff |
|:-----------|:---------|:---------|:---------|:---------|:---------------------|
| | 2018 | 2019 | 2021 | 2022 | % change since 2019 |
| All group-based providers | 236,900 | 247,100 | 236,000 | 248,200 | 0.445164 |
| Childminders | 43,300 | 43,600 | 38,600 | 33,900 | -22.2477 |
| Total | 324,300 | 336,800 | 321,700 | 327,700 | -2.7019 |
| Change on previous year | | 12,500 | -15,100 | 6,000 | |
Source: Education provision: children under five years of age from the Department for Education
This projected increased demand comes against the backdrop of a crisis in recruitment and retention within the sector. This casts doubt on the ability of providers to find the EYPs needed to staff this expansion from within their current workforce. According to Coram's 2023 survey of local authorities in Great Britain, 71% of local authorities report settings finding it 'very difficult' to recruit staff with the requisite qualifications and experience. Sixty-nine percent of local authorities report that these difficulties are decreasing the sustainability of childcare provision in their area (Jarvie et al, 2023). Childcare sufficiency is already particularly tight for younger children; 50% of English local authorities are confident that there is sufficient childcare across all areas for the under-twos, a drop of 7% on the previous year. By comparison, 73% are confident that they have sufficient childcare to provide the 15-hour entitlement to three and four year olds (Jarvie et al, 2023).
Implementing the relaxed staff-child ratios for under twos is a more controversial avenue for providers to free up the current workforce and reduce the overall number of staff required to meet demand. The Institute of Fiscal Studies estimates that the relaxation in ratios could, in a best-case scenario, free up 7,300 full-time equivalent EYPs (Drayton et al, 2023). However, implementing this change to the ratios is not straightforward. EYPs are already stretched; increasing their workload further may only serve to avert potential professionals away from a sector that is already poorly paid and highly demanding. A change to the ratios is also likely to result in reduced quality of provision as EYPs have less time to spend one-on-one with each child. There are strong objections to this change of ratios from within the sector a recent survey by the Early Years Alliance found that 9 out of 10 of its members stated that they would not implement the change (House of Commons Education Committee, 2023).
While this report focuses on demand for ECEC among younger children, it is important to note that demographic changes in the coming years mean that there are projected to be 120,000 fewer three and four year olds between now and 2025-6, a substantial drop (Drayton and Farquharson, 2023). With fewer three and four year olds registered, providers will be able to redirect existing staff towards younger children, and thus cater to some of the increased demand. Calculating exactly how many staff this will free up is beyond the scope of this report, however we note that the ratios of professionals to children over three (1:8 or 1:13 if led by a member of staff with a level six qualification) are much higher than for those under three (1:3 for children aged under two and 1:4 for children aged two). It is therefore unlikely that the freeing up of these professionals will outweigh the increases in demand from the introduction of the new entitlement.
2.4 Where, and among whom, will demand rise the most?
While we expect demand for ECEC is likely to rise overall, this rise is unlikely to be evenly distributed. In this section we consider where, and among whom, demand for ECEC is likely to increase the most. In doing so we consider the distributional impact of the new entitlement across geographical regions and the socioeconomic gradient.
2.4.1 ECEC uptake is likely to be highest in areas of low deprivation, and lowest in urban areas of high deprivation
In section 2.1 we calculated that, across England, 45% of one year olds and 51% of two year olds will be eligible for the new entitlement. While data constraints prevent us from calculating these eligibility estimates at a more granular level, they are likely to vary substantially by local area. We know, for instance, that in the south west of England, 82% of women with dependent children work, compared to 69% in London (ONS, 2021b).
To get some idea of the likely variation in demand for the new entitlement at a local area level we use figures from the Department for Education on the number of children in each area taking up the existing three to four year working entitlement. Since eligibility for the new entitlement is based on the same criteria as eligibility for the existing three to four year working entitlement, we can use the latter as a proxy for the former. Combining this with population data from the 2021 Census we can map the percentage of all three year olds in each area who are signed up to receive the existing working entitlement – a figure that combines both local area eligibility and uptake.
Figure 4: percentage of three year olds signed up for three and four year old working entitlement, 2021, by upper tier local authority
Map of England showing percentage of 3-year-olds registered across different local authority areas, with a legend indicating 12.58 35.99 59.4 for "Percentage of 3 year olds registered".
Source: Education provision: children under five years of age from the Department for Education, Local authority level population estimates from the 2021 Census
Nationally, 38% of three year olds were signed up for the working entitlement in 2021, but this varied significantly by local authority, from 13% in Westminster to 59% in York.
Figure 5 shows the top and bottom 20 local authorities by the percentage of three year olds signed up for the working entitlement. The bars are colour coded by the level of income deprivation affecting children in a local authority as measured by the Income Deprivation Affecting Children (IDACI) index. The local authorities with the highest uptake rates are those with relatively low levels of income deprivation, while the local authorities with low uptake rates tend to be urban areas, predominantly in London, with relatively higher levels of income deprivation. This reflects the fact that the entitlement is targeted towards working families.
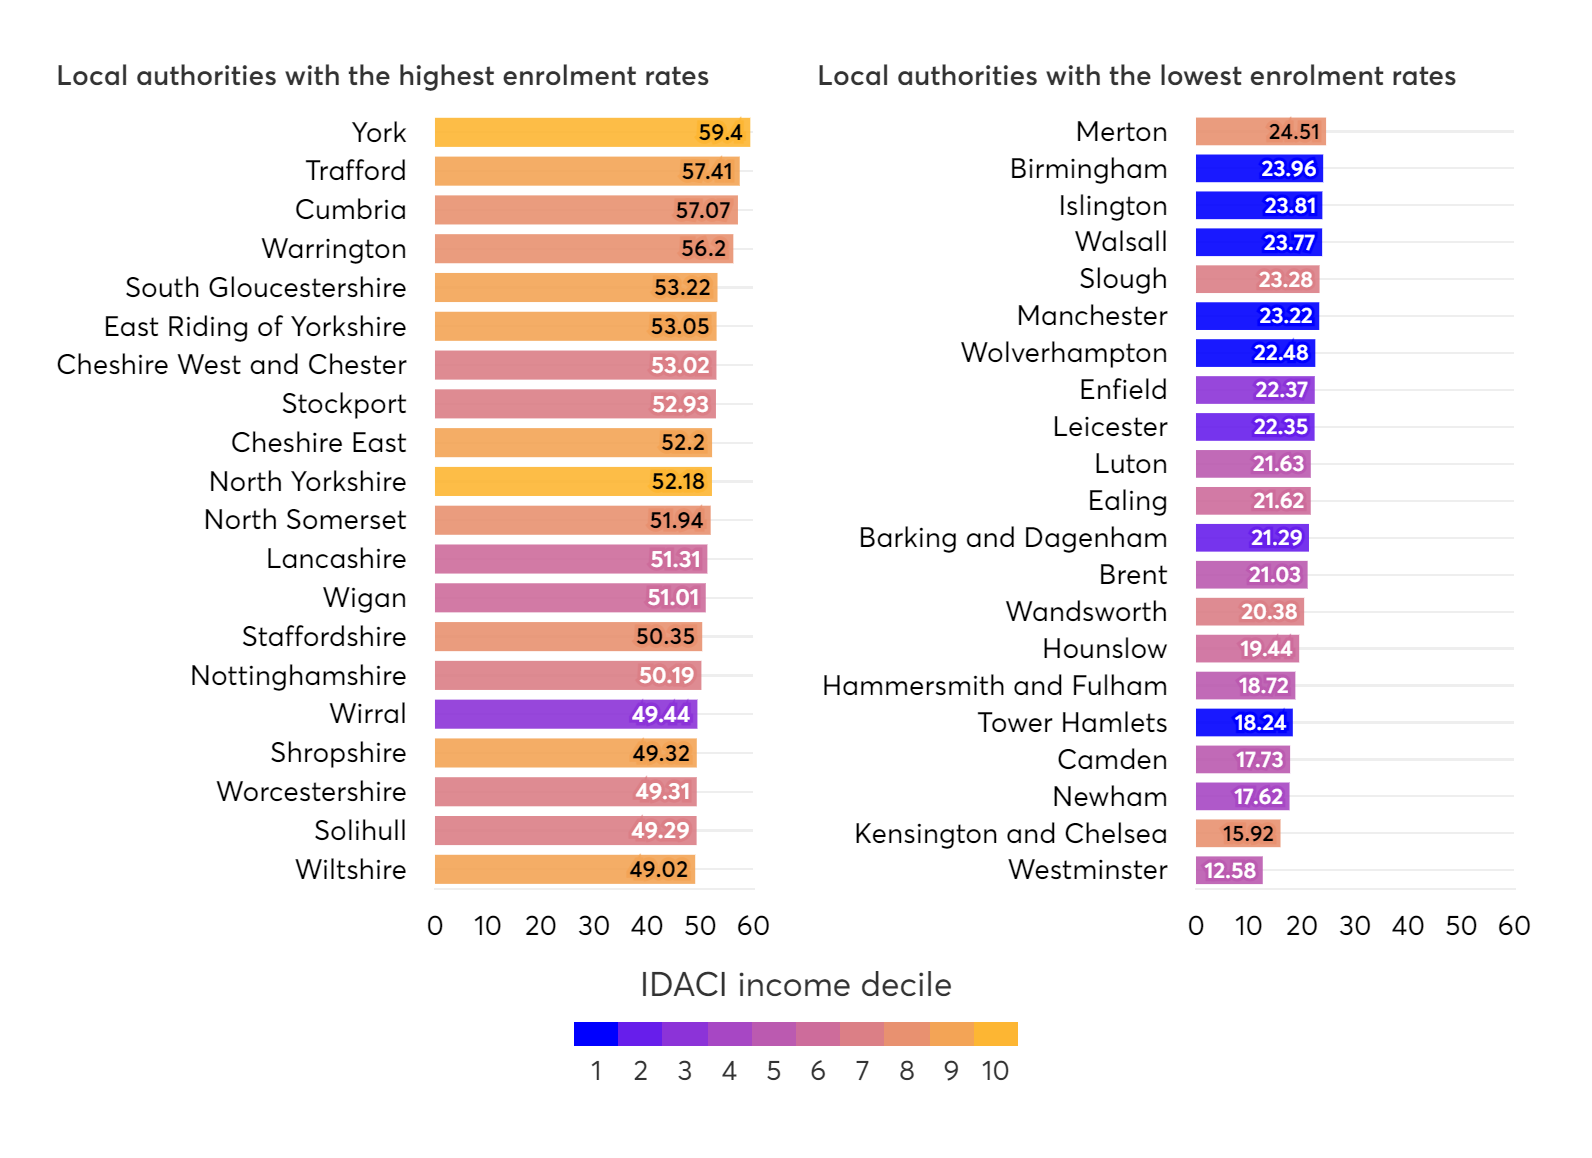
Figure notes: 1 is the most income deprived, 10 is the least.
Source: Education provision: children under five years of age from the Department for Education, Local authority level population estimates from the 2021 Census, English Indices of Deprivation from the Ministry of Housing, Communities and Local Government.
2.4.2 Childcare usage will likely increase overall, but least among low income families
At present, the only children under three who benefit from government-funded childcare hours are disadvantaged two year olds who qualify for 15 hours per week for 38 weeks of the year. This policy was first introduced in 2009 for the 15% most disadvantaged two year olds, and gradually extended in 2013/2014 to cover the approximately 20% and then 40% most disadvantaged.
Eligibility for the policy is based mainly on the receipt of certain benefits, but household income plays a role and must usually be under £16,190. Over the lifetime of this policy, ECEC usage among children living in households with income under £20,000 has risen significantly (figure 6). Average hours of two year olds living in families with household incomes under £10,000 rose by a third from 5 to 6.6 hours between 2011 and 2019. Average hours of two year olds living in families with household incomes between £10,000 and £20,000 rose by 90% from 4.4 to 8.2 hours, overtaking that of families earning between £20,000 and £30,000, likely as a result of the policy. The gap in ECEC usage between the very poorest two year olds and those living in households with median incomes or above narrowed slightly from 7.1 hours in 2011 to 6.6 hours in 2019.
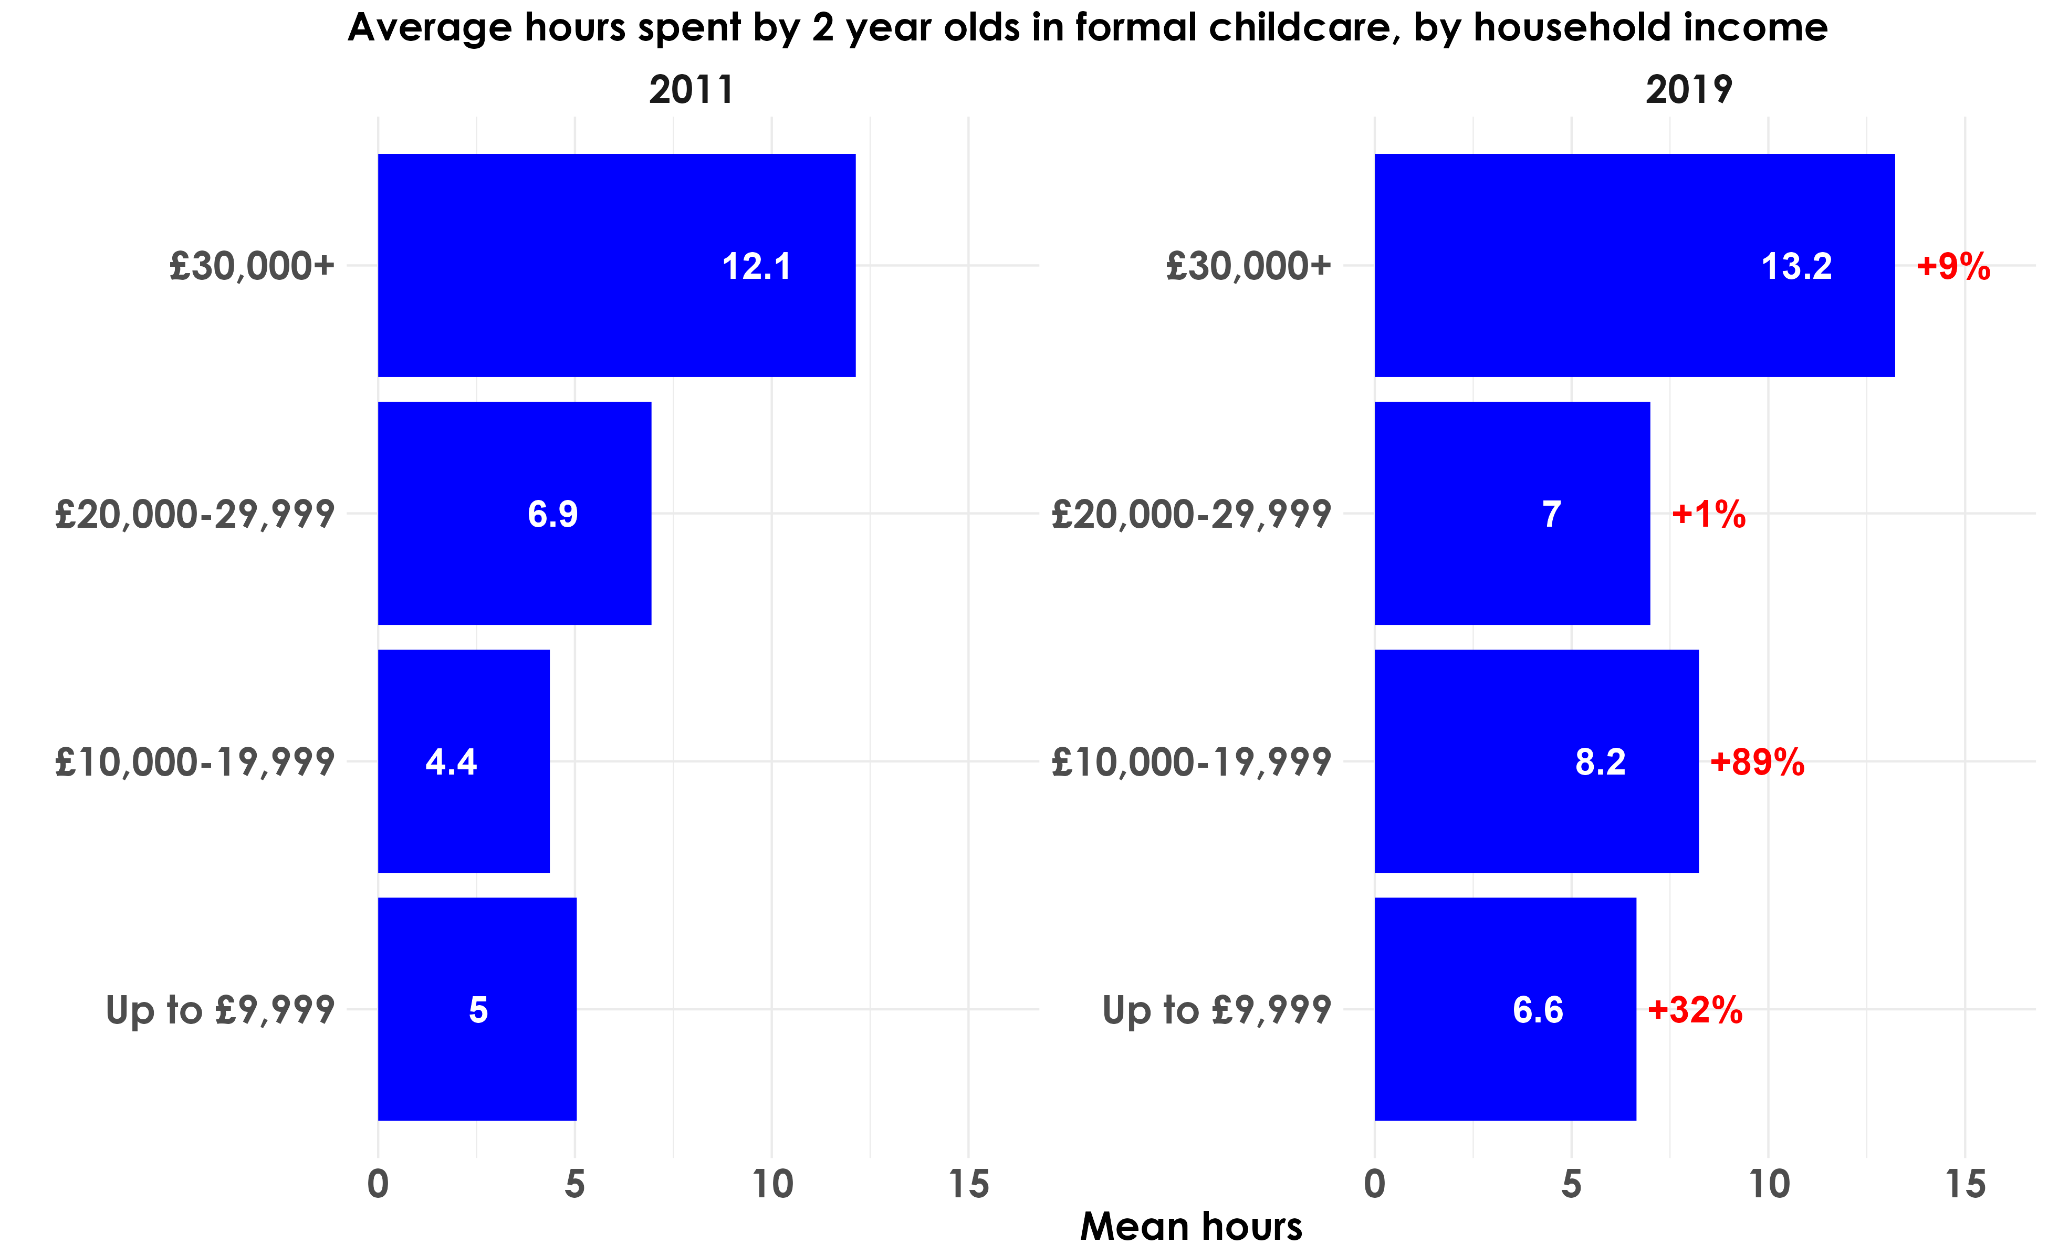
Figure notes: Childcare and Early Years Survey of Parents (2011 and 2019). Income is only available at a household level and in the bands displayed on this graph. Although the policy was first introduced in 2009 for the 15% most disadvantaged two year olds, this period covers its substantial expansion to 40% of two year olds and is selected due to data constraints. It is possible that children in households earning up to £9,999 in 2011 use more hours of ECEC than those in households earning £10,000-£19,999 due to the fact that they were already eligible for the policy.
However, it is likely that some of this narrowing of the gap will be reversed once the new entitlement kicks in: from this point onwards two year olds in working families will have access to 30 hours of free ECEC – double that of the most disadvantaged two year olds.
To explore this hypothesis, in figure 7 we examine the gap in ECEC usage by family income following the introduction of the current universal (yellow bars) and working (blue bars) entitlements.
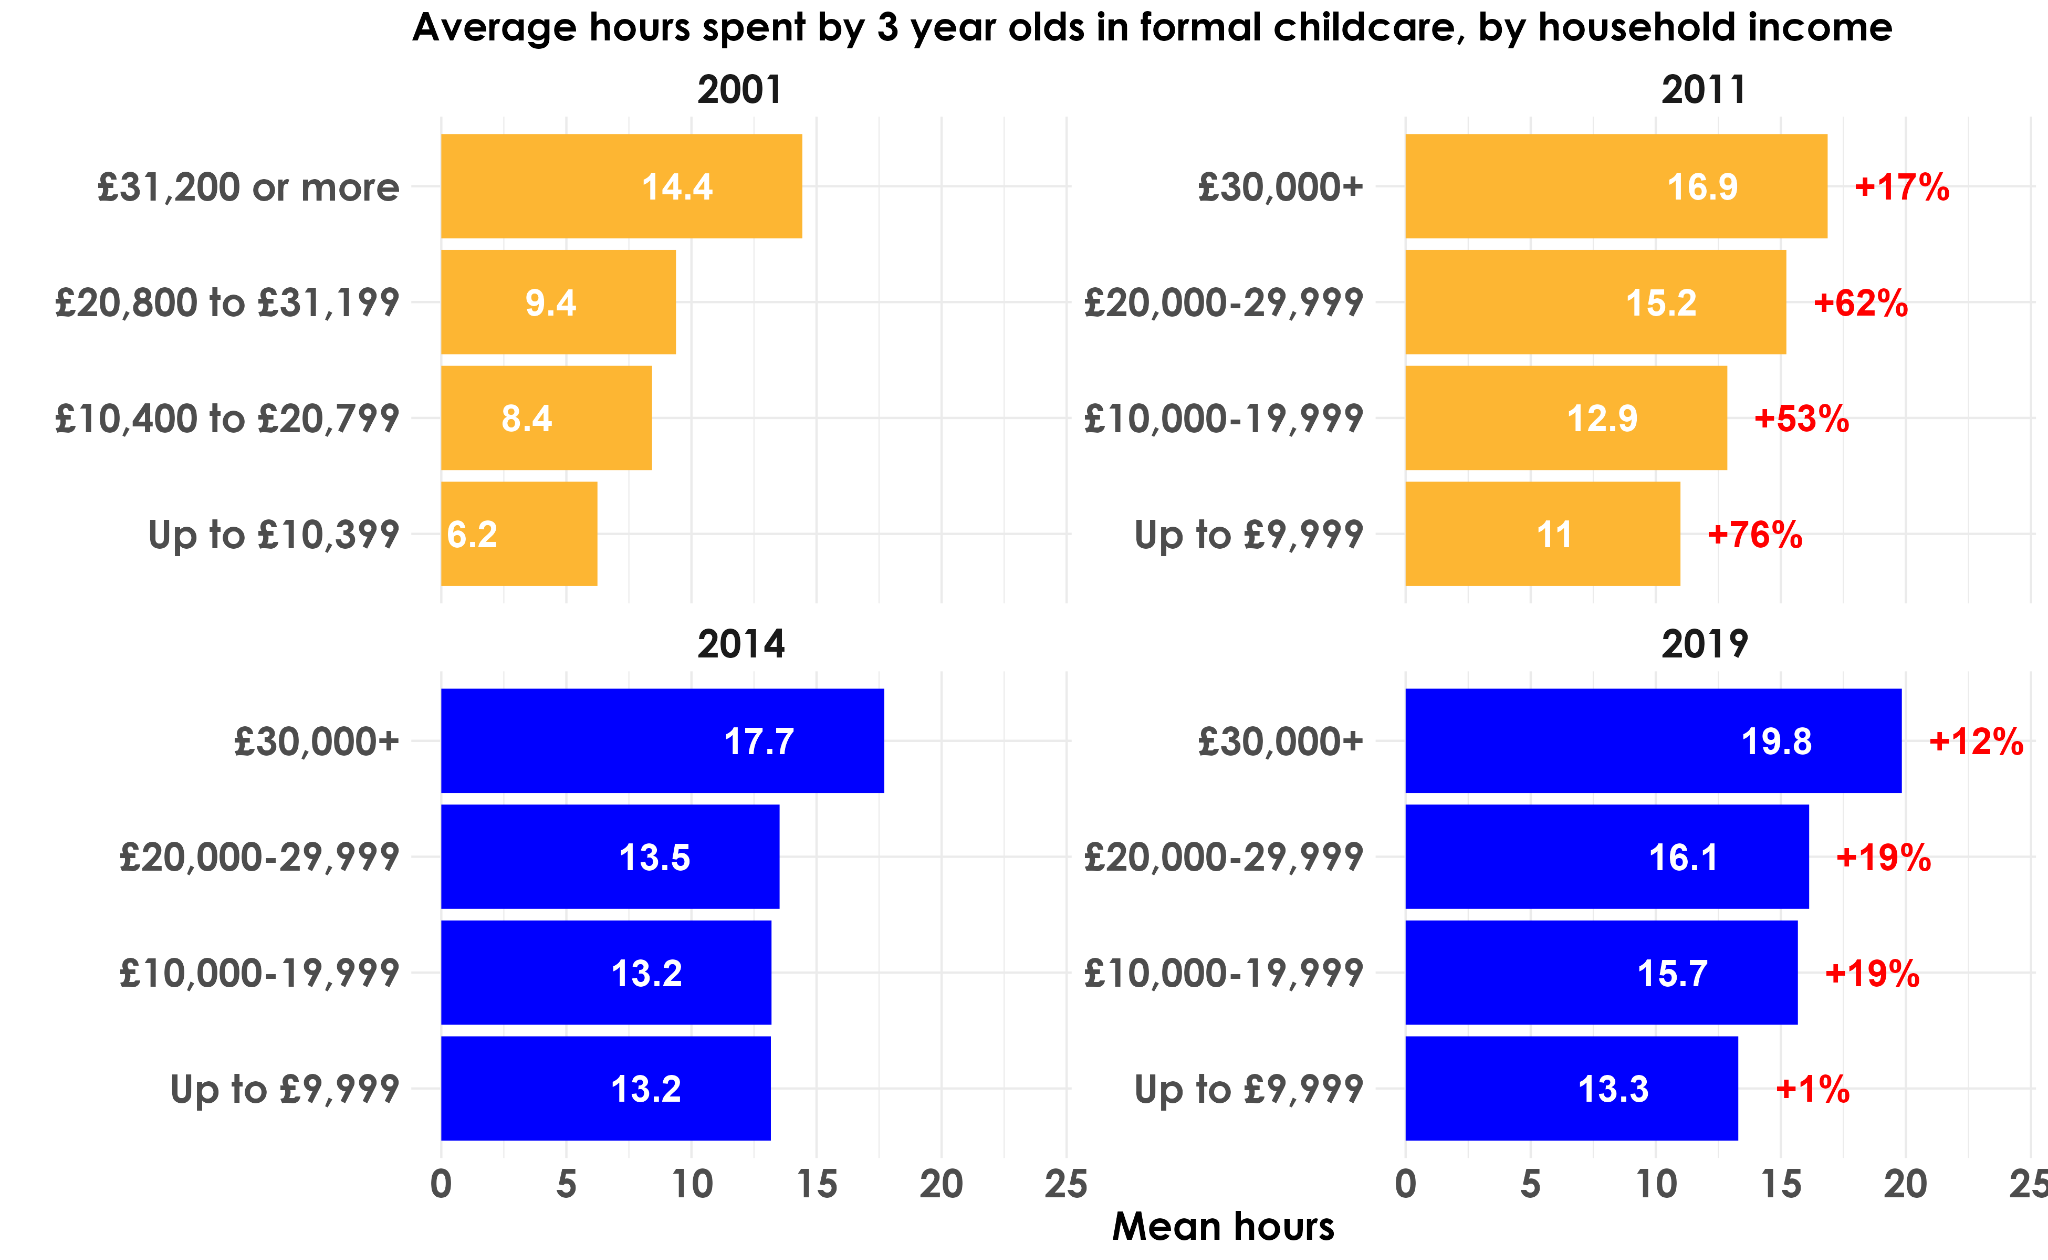
Figure notes: Parent's Demand for Childcare Survey, 2001 and Childcare and Early Years Survey of Parents (2011, 2014-2015 and 2019). Income is only available at a household level and in bands. Note, there are small differences in the definitions of the income bands between the two surveys, but categories are broadly comparable.
The introduction of the universal entitlement increased average ECEC hours across all income brackets. The biggest increases were among families with the lowest household incomes (76%), while median and above income households saw the smallest increase (17%). This led to a narrowing of the gap in hours spent in ECEC between the poorest and median households, from 8.2 hours in 2001, to 5.9 hours in 2011; by 2014 this gap had narrowed to 4.5 hours. By contrast, the working entitlement increased childcare hours across all income bands except the poorest. Families with incomes of less than £10,000 saw no meaningful change in their use of childcare - these families tended to be non-working and therefore ineligible. As a result, the gap in ECEC usage between three year olds in the median and the poorest households started to grow again, standing at 6.5 hours in 2019.
If these patterns are repeated following the introduction of the new working entitlement, then the gap in ECEC usage between working families with below median and above median incomes will narrow. However, as the very poorest families are ineligible for this policy, gaps in ECEC usage between this group and the median will widen.
A large body of evidence demonstrates that high-quality ECEC can have beneficial impacts on children's social, emotional and cognitive outcomes, and that these benefits are stronger for children from disadvantaged backgrounds (Nutbrown, 2012; Melhuish and Gardiner, 2021). Disadvantaged children who attend high-quality education and care go on to do better in school, and access to high-quality ECEC can help to narrow inequalities between children from different backgrounds (Melhuish and Gardiner, 2021). However, as the analysis in this section shows, at present there is a substantial gap in ECEC use between the very poorest children and those with median incomes and this is likely to widen as a result of the new entitlement.
3. Current pressures on the sector
The conclusion of the previous section is that the sector will likely face a substantial increase in demand when the new entitlement is operational. This will put extra pressure on a system that is already resource constrained. In this section, we explore these pressures on the sector in more detail.
Many settings are struggling to recruit and retain suitably qualified EY staff. In section 3.1 we detail a drop in the qualification levels of those providing free entitlements since 2020. In section 3.2 we explore a key factor underlying these difficulties – the pay of EY professionals is more comparable with those working in retail than other education professions. Finally, in 3.3 we explore the drop in the number of settings providing free entitlements since 2020.
3.1 Staff qualifications among those providing free entitlements are declining
Any expansion of provision is likely to come primarily via the PVI sector, where the qualification levels of those providing free entitlements are low and falling.
Quality of provision, as much as quantity, is important in terms of understanding its impact on children. While ECEC quality can be conceptualised in many different ways, one important structural indicator is staff qualifications. The presence of more highly-qualified staff, and graduates in particular, in ECEC settings can have a positive impact on children's outcomes (Sylva et al, 2004; Blanden et al, 2016; Bonetti, 2020), and the presence of more highly qualified staff is linked to improvements in other important aspects of quality, such as positive staff-child interactions (Mathers et al, 2011).
A related consideration is where the childcare takes place. At present, a substantial majority of children – 62% of those registered for the universal entitlement, and 70% of those registered for the working entitlement – attend PVI settings (Figure 8). Historically, the expansion of provision accompanying new government-funded entitlements has happened almost entirely in the PVI sector, which is able to respond more quickly to increased demand (Blanden et al, 2016), so we would expect this share to increase as the new entitlements come into play.
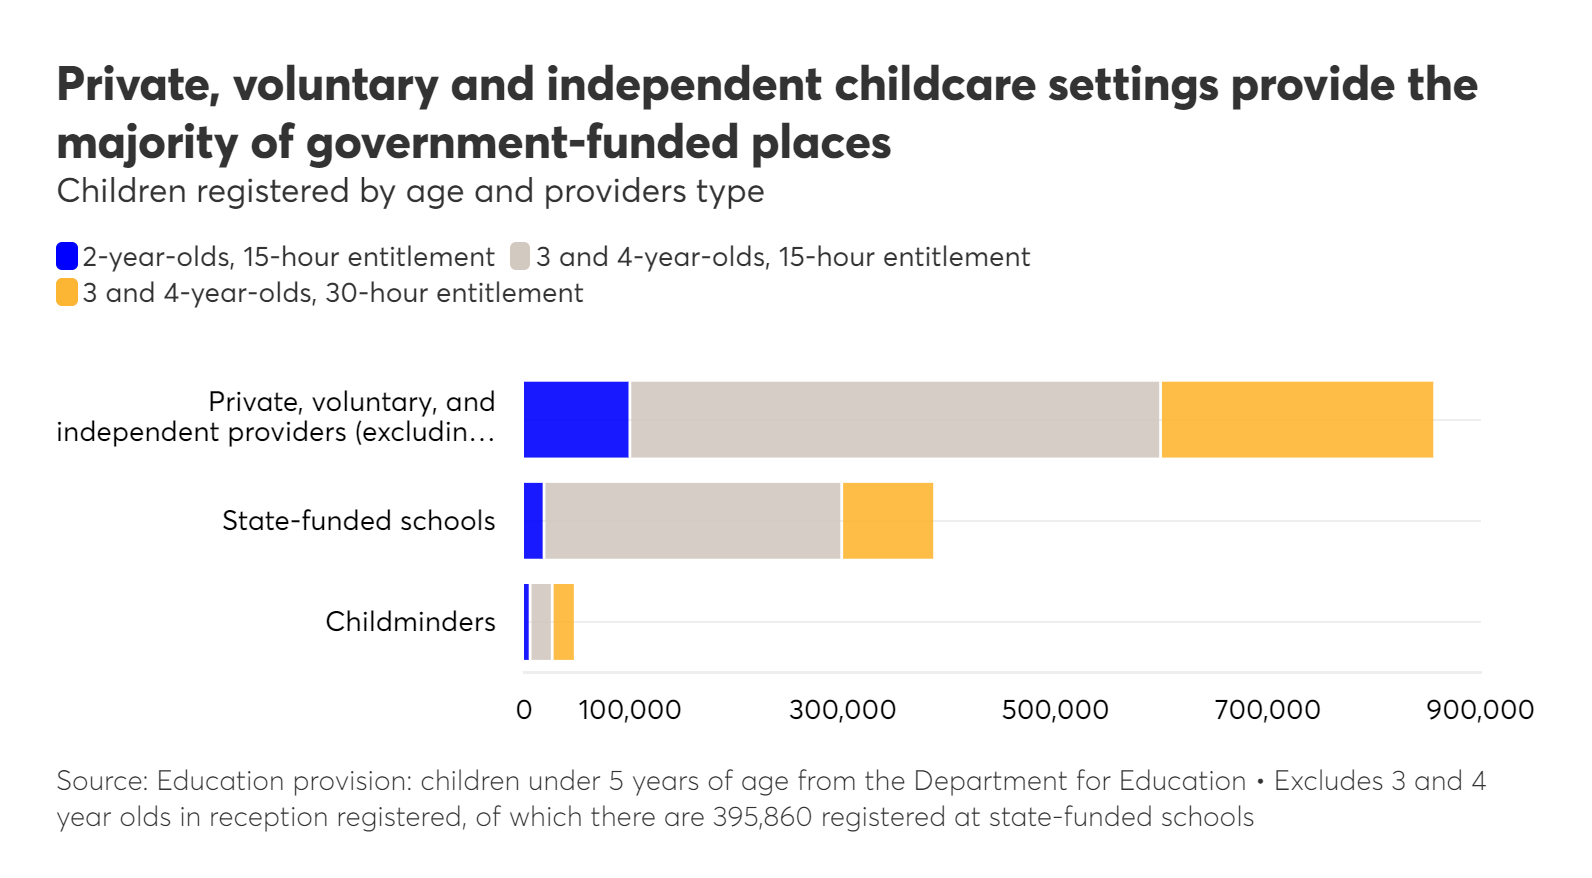
Source: Education provision: children under 5 years of age from the Department for Education Excludes 3 and 4 year olds in reception registered, of which there are 395,860 registered at state-funded schools
This has implications for the qualification levels of those providing funded provision: staff qualification levels in PVI settings are, on average, considerably lower than in school-based settings (Table 5). More worryingly, qualification levels have been falling. Over the last three years there has been a drop in the number of staff with either a graduate or level 3 (A-level equivalent) qualification, delivering funded entitlements in PVI providers, alongside a two percent decrease in the number of staff delivering the entitlements overall (Table 6).
While the proportion of graduate staff has remained stable at 9%, the proportion with a level three qualification has fallen from 63% to 59% and the proportion of staff without an early years' qualification has increased each year from 17% in 2020 to 21% in 2023 (Table 6).
Table 5: staff qualifications by provider type, 2022
|
All school-based providers |
All group-based providers |
Childminders |
| No UK early years qualification |
6% |
10% |
13% |
| Level 1 |
2% |
0% |
6% |
| Level 2 |
10% |
10% |
7% |
| Level 3 |
37% |
61% |
55% |
| Level 4 |
6% |
4% |
5% |
| Level 5 |
5% |
5% |
4% |
| Level 6 |
34% |
11% |
10% |
| Overseas qualification |
no data |
no data |
1% |
Source: Childcare and Early Years Providers' Survey
Table 6: PVI staff by highest qualification in England between 2020 and 2023
|
2020 |
2021 |
2022 |
2023 |
| Total |
|
|
|
|
| Number of staff |
256,379 |
243,710 |
249,263 |
250,662 |
| Percentage of staff |
100.0% |
100.0% |
100.0% |
100.0% |
| Accredited graduate status |
|
|
|
|
| Number of staff |
23,075 |
21,877 |
21,891 |
21,536 |
| Percentage of staff |
9.0% |
9.0% |
8.8% |
8.6% |
| Full and relevant EY level 3 |
|
|
|
|
| Number of staff |
160,749 |
153,442 |
153,186 |
148,740 |
| Percentage of staff |
62.7% |
63.0% |
61.5% |
59.3% |
| Full and relevant EY level 2 |
|
|
|
|
| Number of staff |
27,713 |
25,118 |
26,402 |
26,628 |
| Percentage of staff |
10.8% |
10.3% |
10.6% |
10.6% |
| No qualifications |
|
|
|
|
| Number of staff |
44,842 |
43,273 |
47,784 |
53,758 |
| Percentage of staff |
17.5% |
18% |
19% |
21% |
Source: Education provision: children under five years of age from the Department for Education
Moreover, the underfunding of the government entitlements presents significant challenges for the PVI sector in responding to the expansion of hours while maintaining or improving staff quality. The government funds settings that provide free entitlements, but the amount provided is insufficient to cover costs, with an estimated shortfall of £3,000 per year per child accessing a 30-hours place (Women's Budget Group, 2023). Inadequate funding for providers means that many struggle to pay EY staff salaries commensurate with the demands of the job, or that reward experience and years of service.
Poor pay and demanding working conditions makes the recruitment of qualified candidates into the sector challenging: just 534 students started early years initial teacher training in 2022/2023, compared to a peak of 2,327 in 2013/2014. The number of students beginning apprenticeships leading to level 2 or 3 qualifications has fallen by 40% in recent years, from 27,200 in 2016/2017 to 16,200 in 2021/2022 (Ofsted, 2022). The most recent Ofsted report noted that many providers are responding to these challenges by diverting their most qualified and experienced staff towards older, preschool children, suggesting that qualification levels of those caring for under threes are lower than those outlined in table 6 (Ofsted, 2023).
Salaries and conditions are worse in the PVI than in the maintained sector, making recruitment difficulties more acute; these settings are likely to struggle to attract and retain suitably qualified candidates when responding to new demand. Given the squeeze in finances and a lack of defined career trajectories, there are already few incentives for either providers or EYPs to invest in higher qualification levels. There is therefore a substantial risk that the increased demand projected by our analysis is delivered via a further decline in qualifications among EYPs, particularly those working in the PVI sector.
3.2 Pay of EYPs is more comparable with those working in retail than other education professions, leading to recruitment pressures
Despite substantial crossover in required skills, EYPs trail other education professionals in terms of pay. EYP salaries are closer to those working in retail.
Despite the skilled nature of the job and demanding working conditions, EYPs are relatively poorly paid. This impacts the flow of qualified professionals into the sector and also means that many EYPs leave for similarly remunerated jobs with better conditions elsewhere. Almost half of those leaving the profession move into retail with 41% of leavers looking for higher salaries (NDNA, 2019).
In this section we analyse salaries in the EY sector using a novel dataset – Nesta's Open Jobs Observatory – which consists of millions of job postings scraped from an online aggregator site collected between January 2021 and March 2023. This allows us to build a real-time picture of salaries on offer in EY job listings, as well as the qualification levels and skills requested. We then compare salaries in the EY sector to those in comparator professions, chosen either because they require similar skills, or are frequent destinations for leavers from the sector. For further detail on the dataset and methodology underpinning the results in this section, please see appendix section 7.2.
While this dataset allows us to gain access to real-time data on salaries, it is subject to several limitations. Data comes from a single aggregator site so may not be representative of all postings. Not all adverts include salaries, and jobs that advertise salaries tend to do so because they are higher, so salary ranges should be read as estimates, rather than precise figures. When salaries are given, they are typically advertised as a maximum and minimum salary so we display these separately in all analyses.
Figure 9 illustrates the top 10 skills requested in adverts for EY professionals, teachers, waiters and retail assistants. There is substantial overlap between the requirements for EYPs and teachers, particularly primary teachers. There is some overlap with waiters but much less with retail assistants, despite the fact almost half those leaving the sector are headed for retail jobs. However, as figure 10 demonstrates, salaries for EYPs are more similar to those working in retail and hospitality than to other education professions. Median salaries for EYPs are approximately £22,500-£25,000, compared to £22,000-£23,500 for retail assistants, £23,000-£26,000 for waiters, and £31,500-£45,500 for primary and secondary teachers. The spread of salaries (as shown by the size of the coloured box) is also much narrower for EYPs compared to other education professionals, meaning that there is far less variation in salaries for EYP than for other education professionals, potentially indicating a limited scope for increased wages with experience.
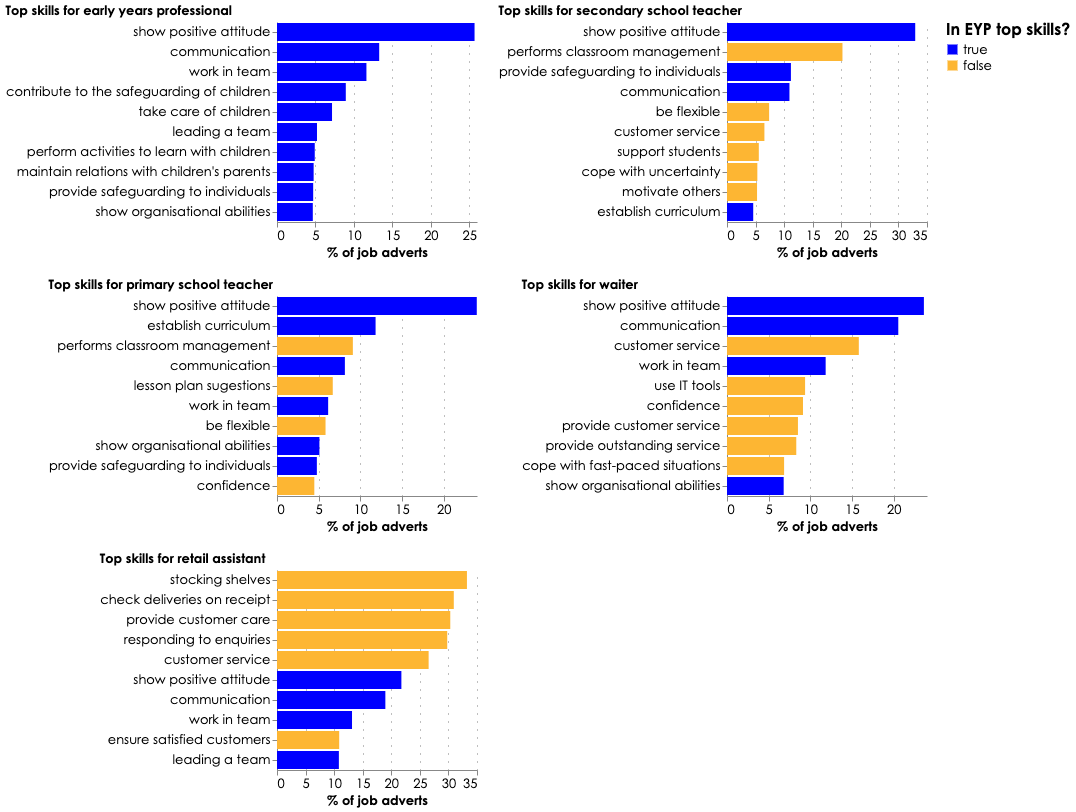
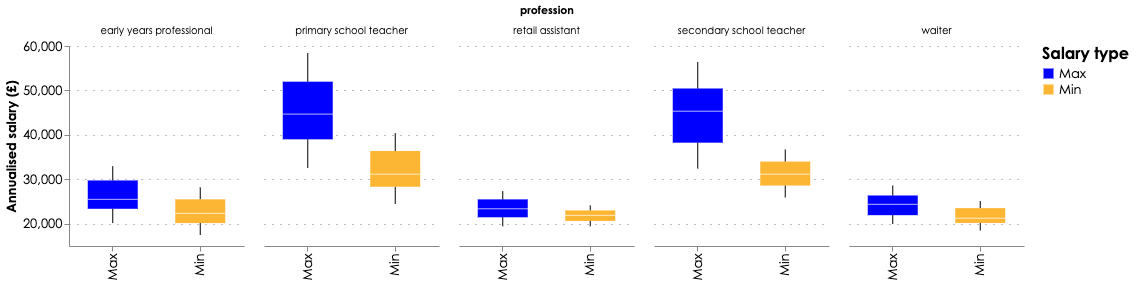
Figure notes: as many adverts offer a minimum and maximum salary we display these separately. The box plots summarise the distribution of salaries where the line in the middle of the box represents the median; the lower and upper parts of the box represent the first and third quartile and the whiskers represent a multiple of the interquartile range (not min/maximum salaries).
Unlike EYPs, primary and secondary teachers are required to have degree level qualifications to teach in most English schools. Figure 11 breaks down the salary ranges offered in EYP adverts targeting different qualification levels. Level 6 EYPs have qualification levels similar to those of primary and secondary teachers. Median salaries are substantially higher for those with level 6 qualifications, but at £30,500-£41,000 are still lower than other education professionals. Minimum median salaries for those with level 2 qualifications (£20,000) are below those of retail assistants (£22,000). Maximum median salaries for retail assistants are similar to minimum median salaries for level 3 EYPs.
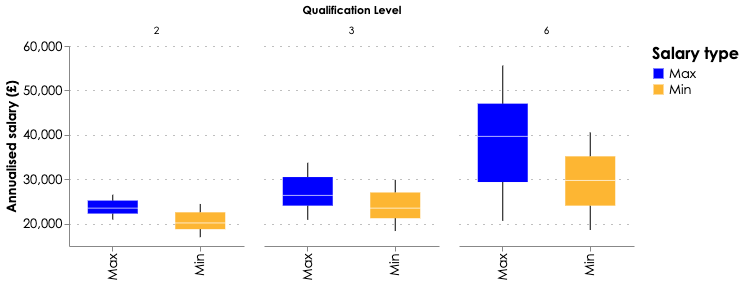
Figure notes: number of job adverts for each qualification level (level 2 - 1066, level 3 - 4260, level 6 - 1066). Adverts mentioning multiple different qualification levels have been dropped from this analysis to increase precision.
3.3 The number of settings providing free entitlement hours is falling
The new entitlement will lead to a substantial increase in demand for funded places, but since 2020 there has been a fall in the number of settings offering existing entitlements, raising questions over whether the sector has the capacity to expand to meet that demand.
Over the last three years the number of providers of any type delivering free entitlements to children in nursery has declined every year. There are now 6% fewer providers delivering the universal 15-hour entitlement and 4% fewer providers delivering the working 30-hour entitlement than there were in 2020 (Table 7) (DfE, 2023). This is driven by a fall in both private and voluntary providers and childminders offering funded hours, only partially offset by a small rise in state-funded settings, which account for a much smaller proportion of provision overall. This suggests that the number of funded early year places is falling. Local authorities (43%) also reported a reduced number of education entitlement places between 2022 and 2023 (Jarvie et al, 2023).
Table 7: number of providers delivering funded entitlements by provider type
| Category |
15-hour entitlement 2020 |
15-hour entitlement 2021 |
15-hour entitlement 2022 |
15-hour entitlement 2023 |
15-hour entitlement Change 2020-2023 |
30-hour entitlement 2020 |
30-hour entitlement 2021 |
30-hour entitlement 2022 |
30-hour entitlement 2023 |
30-hour entitlement Change 2020-2023 |
| Total |
41,941 |
41,570 |
40,478 |
39,526 |
-6% |
36,872 |
35,870 |
35,804 |
35,258 |
-4% |
| Private and voluntary providers |
20,212 |
19,866 |
19,641 |
19,010 |
-6% |
18,401 |
18,006 |
18,146 |
17,719 |
-4% |
| Independent schools |
808 |
809 |
806 |
817 |
+1% |
387 |
393 |
417 |
442 |
+14% |
| Childminders |
12,682 |
12,606 |
11,617 |
11,160 |
-12% |
12,283 |
11,450 |
10,813 |
10,328 |
-16% |
| State-funded schools |
8,239 |
8,289 |
8,414 |
8,539 |
+4% |
5,801 |
6,021 |
6,428 |
6,769 |
+17% |
Source: Education provision: children under five years of age from the Department for Education
Declining numbers of private and voluntary providers delivering funded entitlements have not been distributed equally across the country (figures 12 and 13). In Derbyshire there has been a 38% drop in the number of private and voluntary providers delivering the 30-hour working or 15-hour universal entitlements since 2020, while Greenwich has seen a 19% rise. Middlesbrough has 22% fewer private and voluntary providers offering the universal entitlement to three and four year olds, compared to 2020.
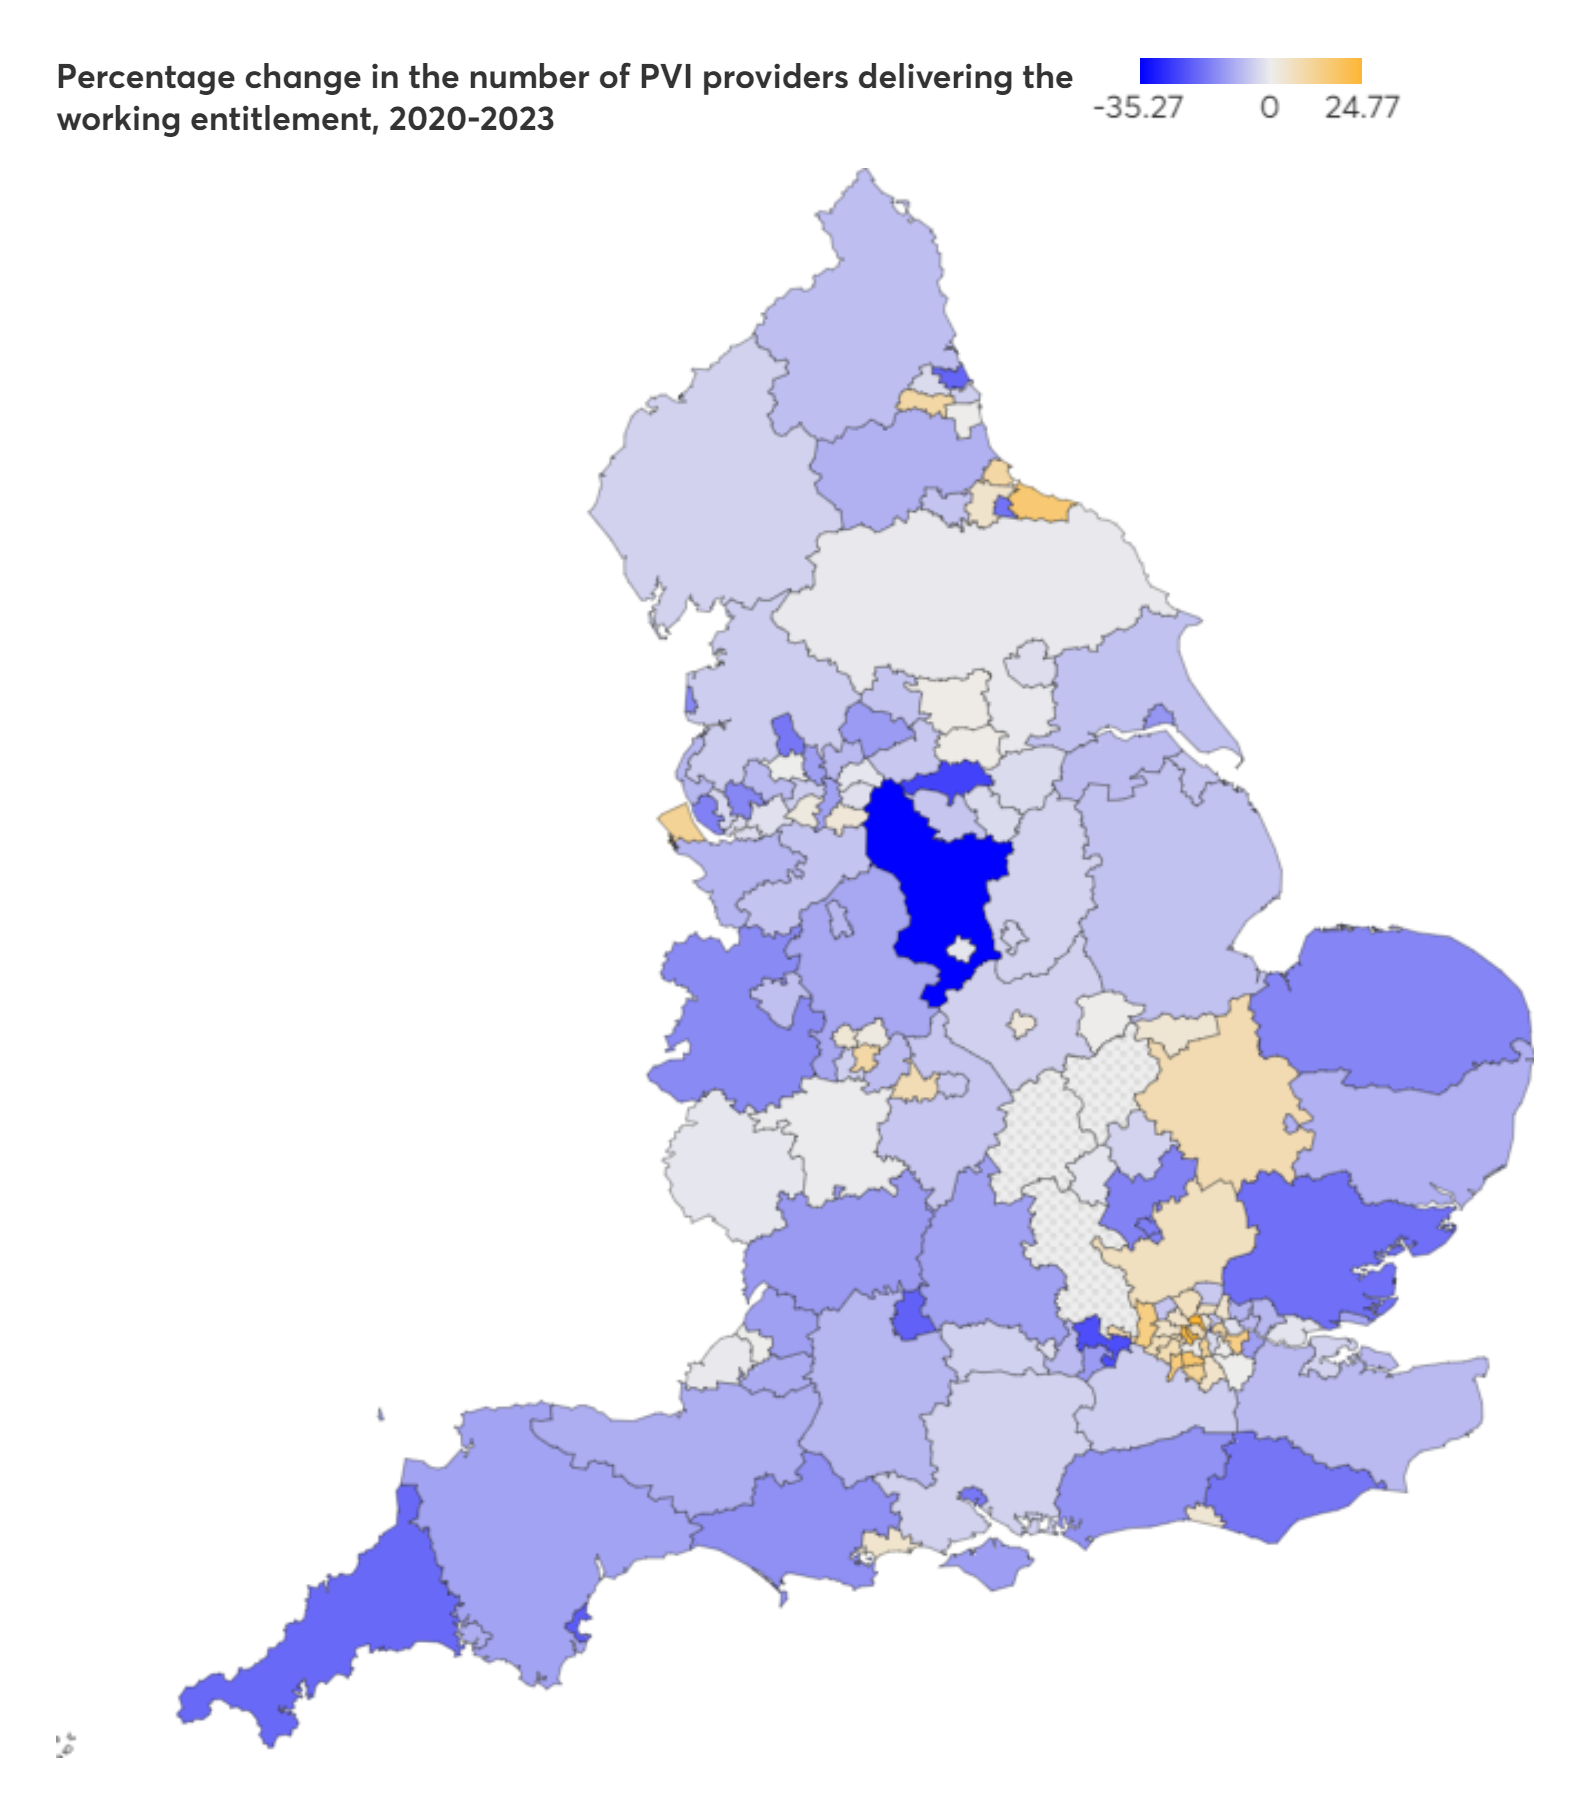
Source: Education provision: children under five years of age from the Department for Education. Figures do not include independent schools.
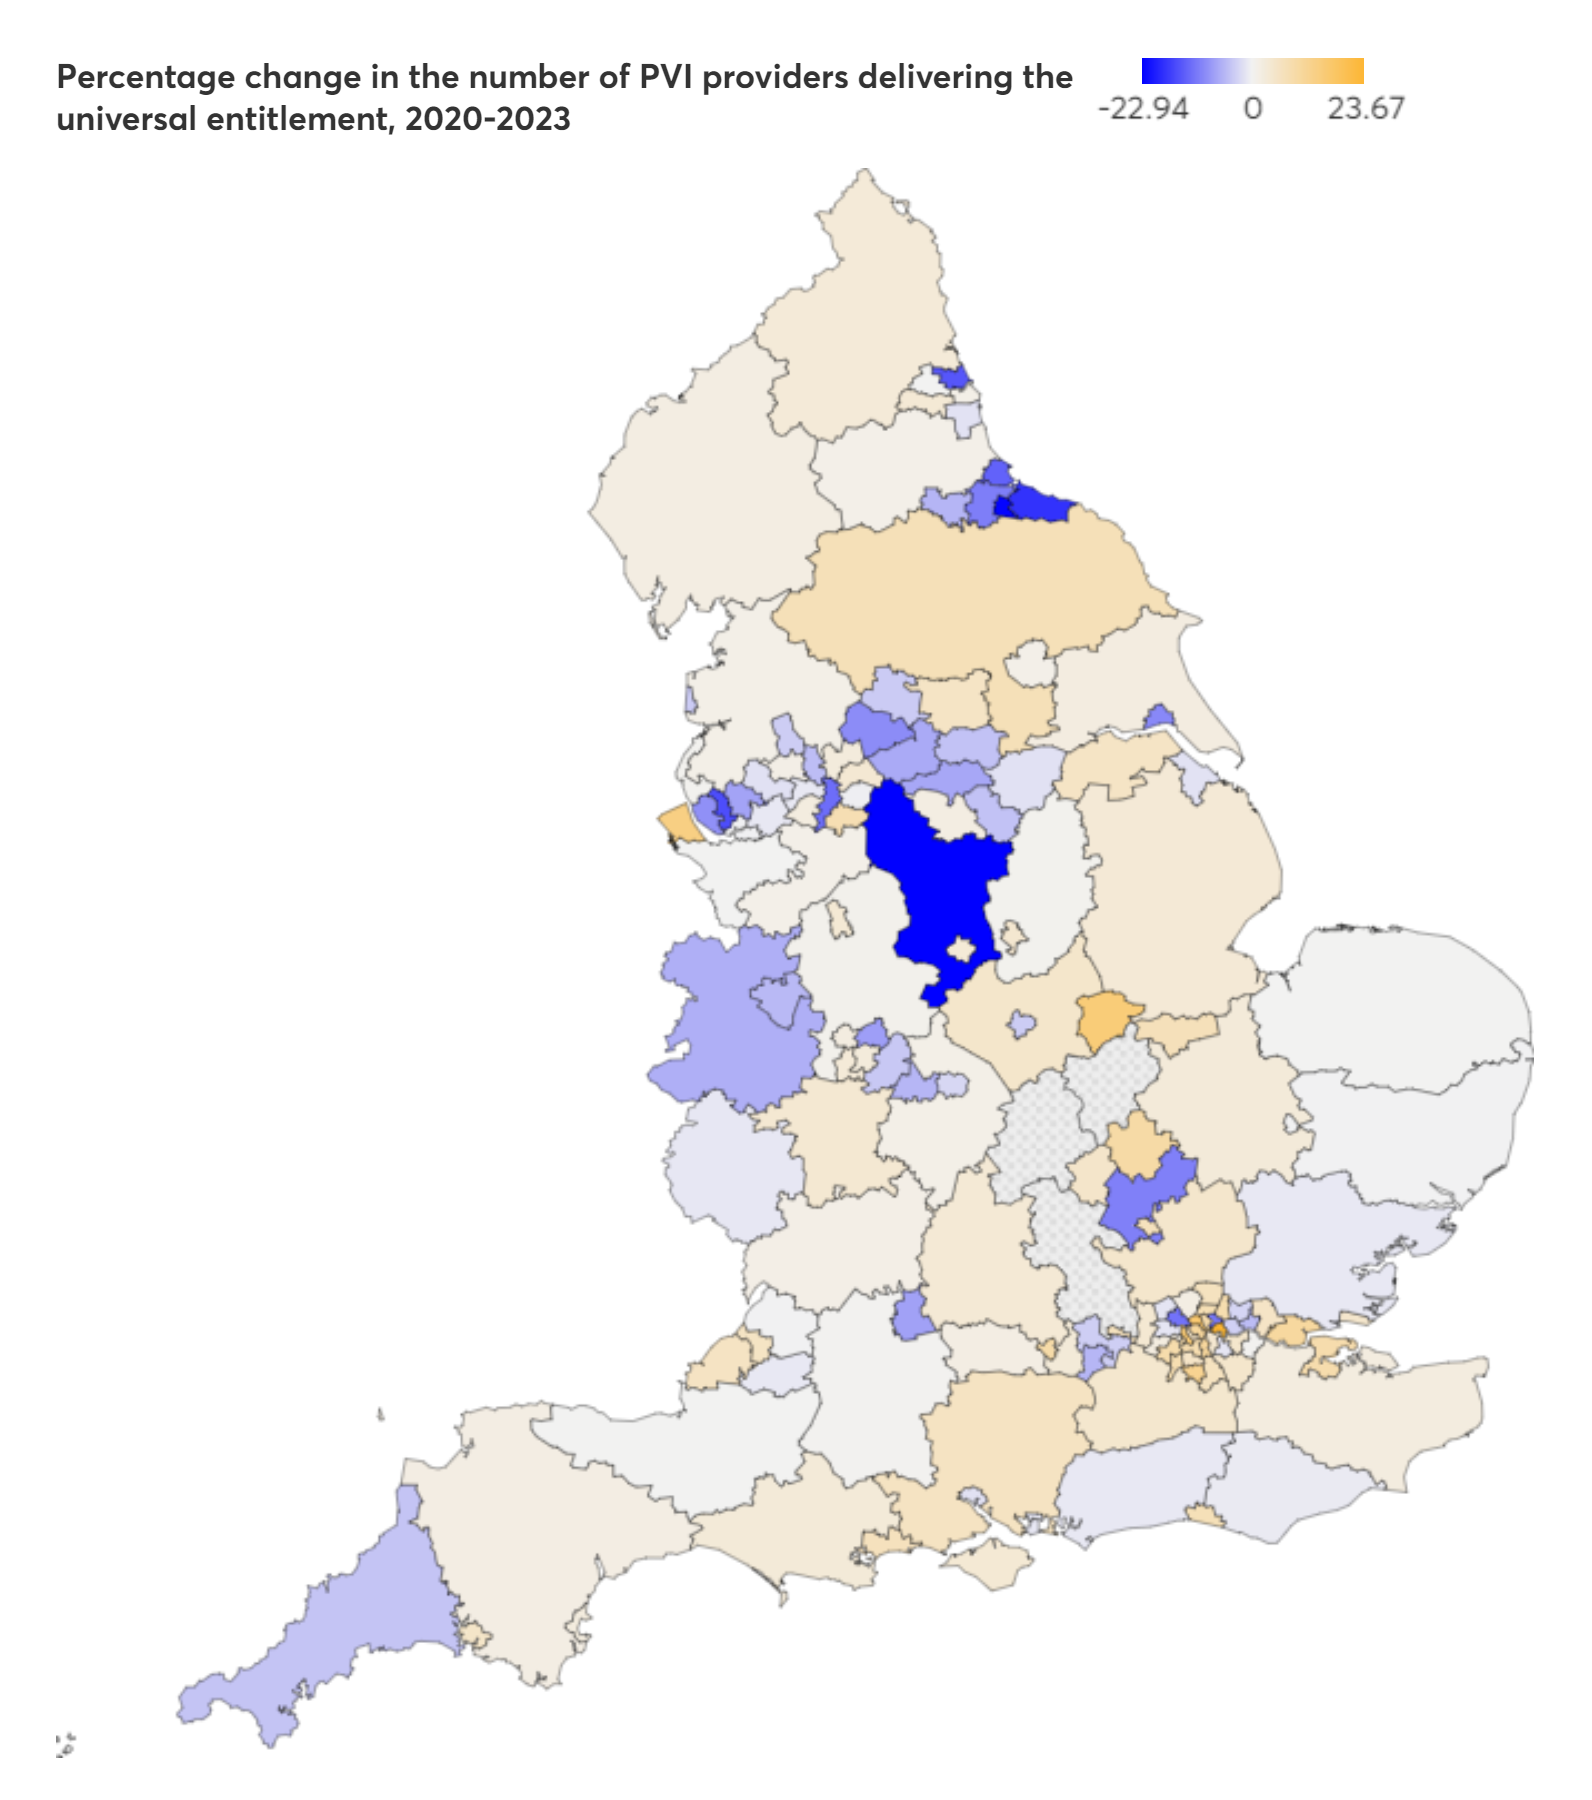
Source: Education provision: children under five years of age from the Department for Education. Figures do not include independent schools
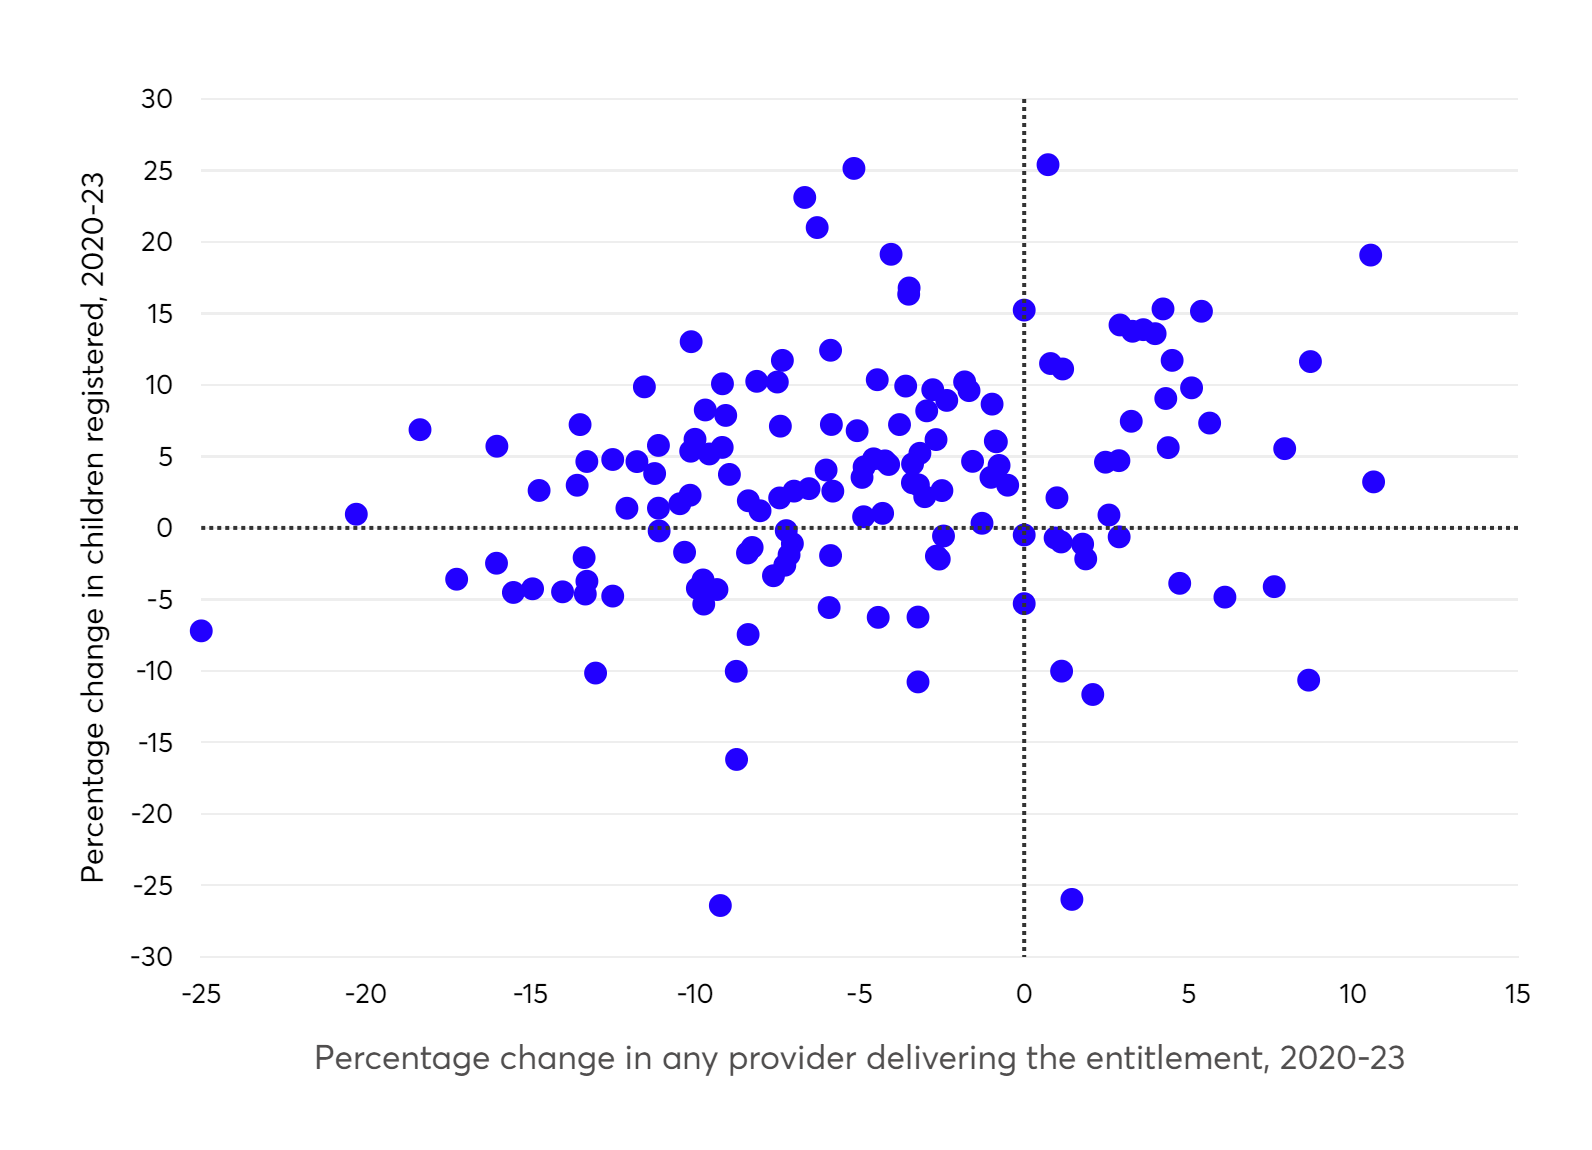
Provider numbers may be falling due to a decline in the number of children signed up for the free entitlements. Figure 14 plots the change in the number of providers of any type delivering the working entitlement to three and four year olds between 2020 and 2023 against the change in the number of three and four year olds registered for it. In general, areas which have seen a bigger decline in children registered for the entitlement have also seen a larger decline in the number of providers offering it. However, the relationship is weak, and roughly half of local authorities have seen registrations increase while the number of providers offering the entitlement has fallen (top left quadrant). These local authorities, which have seen a recent decline in providers without a corresponding fall in the number of children registered, may struggle most with the new entitlement as services are likely to already be under pressure.
Figure 14: change in number of three and four year olds registered for the working entitlement, and total number of providers delivering it, 2020-23.
About half of the LAs have seen registrations for the working entitlement increase and provider numbers fall.
Source: Education provision: children under five years of age from the Department for Education
PVIs are not mandated to offer government funded hours. One reason why they may choose not to is because of the funding gap between the cost to provide the entitlement place and the amount paid by the government to the setting providing it. In recent years, rising sector costs – in particular an increase in the National Minimum Wage – have not been met with an associated increase in government funding rates, and low rates are identified by providers as the main cause of both low pay and instability in their settings (Haux et al, 2022). Providers are forced to cross-subsidise by either increasing the amount charged for non-funded hours or charging for extras, such as consumables. This is less tenable for providers working in more deprived areas, as parents are less able to be able to pay any supplementary costs, and are more likely to only take up their free entitlement without any additional hours on top.
We find some evidence that provider closures, particularly among those offering the universal entitlement, are hitting disadvantaged children hardest. Figure 15 compares the decline in the number of PVI settings delivering free universal entitlement places against the decline in the number of children registered for the entitlement. The size of the bubbles indicates the amount of deprivation affecting local children, as measured by the Income Deprivation Affecting Children Index (IDACI), where larger bubbles are less deprived areas. The majority of local authorities have seen falls not only in provider numbers but also the number of children registered (bottom left quadrant). However, in some areas PVI provider numbers are falling even as registrations have increased (top left quadrant). The graph below indicates that many of these are in the poorest areas. Of the 20 local authorities with the biggest gap between the fall in the number of group PVI providers delivering the universal entitlement and the number of children registered to receive it, seven are in the first IDACI decile (most deprived), a further three are in the second and only three are in areas with below average child poverty.
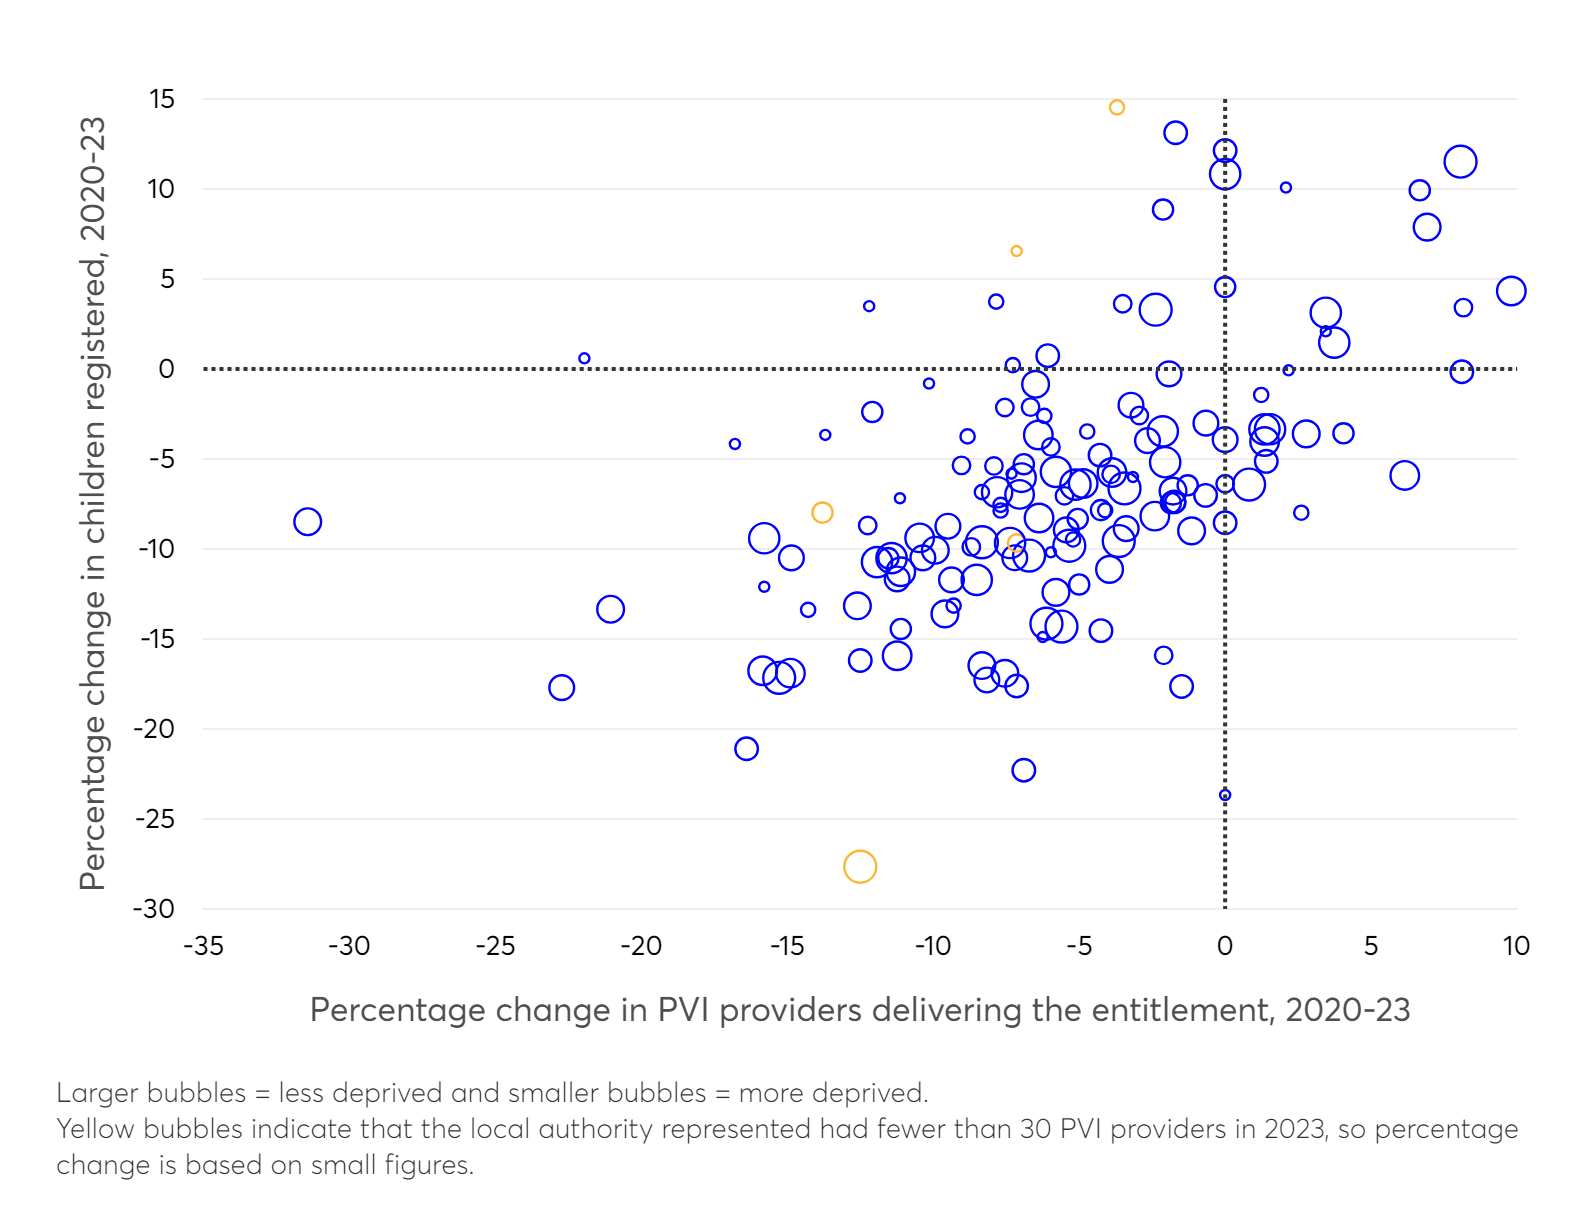
Larger bubbles = less deprived and smaller bubbles = more deprived. Yellow bubbles indicate that the local authority represented had fewer than 30 PVI providers in 2023, so percentage change is based on small figures.
Source: Education provision: children under five years of age from the Department for Education. Figures do not include independent schools.
4. Conclusion
From a demand viewpoint, the expansion of childcare entitlements announced in the spring budget 2023 will be welcomed by many families across England. Childcare is expensive, and so any help in covering costs is good news. From a supply perspective, the new entitlement has many implications. First and foremost, it presents a huge staffing challenge for the sector. We estimate that by 2028, when the new entitlement is fully operational, ECEC usage will rise by 46% for one year olds and 33% for two year olds compared to current levels. To meet this demand, the sector requires between 25,000 and 27,500 EYPs. This equates to seven to eight percent of the current workforce.
There are reasons to believe that the sector would struggle to absorb this demand: the number of staff has fallen by three percent since 2019. In PVI settings the number of graduates delivering free entitlement hours has fallen by 1,500 since 2020, and staff without qualifications make up an increasing share of those delivering free entitlement hours. The number of providers offering free entitlements has also declined: there are now six percent fewer providers delivering the universal 15-hour entitlement and four percent fewer providers delivering the working 30-hour entitlement than there were in 2020, creating concerns about the availability of places. On the other hand, a substantial fall in the number of three and four year olds between now and the mid-2020s means that a proportion of what is needed can come from within the existing workforce.
Tweaking around the edges by relaxing ratios or giving additional, but insufficient, funding for childcare places are not sustainable approaches to alleviate pressures on the workforce. If anything, the former would only serve to place additional burden on existing staff, potentially risking their departure from the sector.
Getting this wrong could have profound implications for children in England, especially disadvantaged children. High-quality ECEC is associated with better outcomes, not just in school (Bonetti and Blanden, 2020; Melhuish and Gardiner, 2021) but in life (Bustamante et al, 2022). There are two main ways to improve quality – (i) ensure there are enough staff, and (ii) ensure those staff are highly trained. England is underperforming on both fronts currently.
Low pay is undoubtedly part of the problem. Nearly half of EYPs leaving the sector are moving into retail, as the gap between salaries in EYP and retail jobs has narrowed (Akhal, 2019). Our analysis, using a novel dataset – the Open Jobs Observatory – suggests that median minimum salaries for an EYP without a degree are similar to those working in retail, while maximum salaries are just eight percent higher. Other factors, such as limited career progression and the perceived low status of EYPs, are likely to contribute too.
Our analysis is subject to a number of limitations which we have set out throughout the report but highlight again here. Firstly, although the new policy applies to children aged nine months and over, given data limitations we were only able to model increased demand among children from the age of one. Secondly, our conversion of increased ECEC hours into additional staff assumed a perfect allocation of staff to hours. These first two limitations serve to make our estimate a conservative one.
On the other hand the central influence on our estimate – the impact of the new entitlement on parents' behaviour – is inherently unknowable. We try to account for this by modelling three different scenarios but are inevitably unable to eliminate all uncertainty. Finally, as the focus of this report is increased demand linked to the new entitlement, and the number of EYPs required to fulfil it, we limit our scope to looking at changes in ECEC usage among the under-threes. In doing so we account for small projected drops in the number of one and two year olds between now and 2028. We do not, however, account for larger falls in the number of three and four year olds over the same period (Drayton and Farquharson, 2023). While this does not affect our estimate for the number of EYPs needed to deliver the increased demand, it does mean that at least some of that demand can be met by redeploying existing staff. Estimating the exact proportion of those that could be redeployed is beyond the scope of this report.
In this research, we focused on estimating the size of the problem we face in the EY sector. Our next piece in this series looks at where future governments should invest to make the EY sector more sustainable and provide the best possible start for all children. The past 10 years have seen major expansions (free ECEC) and contractions (falls in benefit spending, closures of children's centres) in the services and support for families across England. Our next piece will ask: what has worked well, what should a future government try to reinstate and what innovations are needed to address the disadvantage gap between children growing up in poverty and the national average.
5. Endnotes
- Benefits include Income Support, income-based Jobseeker's Allowance (JSA), income-related Employment and Support Allowance (ESA), Universal Credit, the guaranteed element of Pension Credit, Child Tax Credit, Working Tax Credit and the Working Tax Credit four-week run on.
- This is itself based on evidence from the UK on the impact of eligibility for part-time and full-time childcare on the working patterns of mothers of three and four year olds (Brewer et al, 2022).
- The median birth interval in the UK between first and second births is 35 months (two years nine months) (ONS, 2021a). Therefore, the median woman's first child would be over three by the time her second child qualified for the policy.
- Data on earnings in the Childcare and Early Years Survey of Parents is only available at a household level in bands and therefore likely eligibility is inferred based on working hours and household income.
- See Blanden et al (2016) for a detailed description of the introduction of the universal 15-hours policy, which took place in phases.
- Part of the motivation for this scenario is to account for the uncertainty over the degree of crossover between those currently eligible for the 15-hour disadvantaged two year old offer and those eligible for the 30-hour offer.
- Please see appendix table 1 for a detailed breakdown of assumed average weekly ECEC hours and total increase in hours for each scenario.
- Nationally, uptake among those eligible is estimated to be about 80%, but data constraints prevent the calculation of this figure at a local area level. (DfE, 2023)
- An IDACI income decile of 1 means that the local authority ranks in the top 10% of English local authorities in terms of the proportion of children living in income deprived families, while 10 means the local authority has relatively fewer children living in income deprived families.
10For example, children whose parents receive either Working Tax Credits or Universal Credit qualify if their household income is below £16,190 or £15,400 respectively.
11In the dataset we use, the Childcare and Early Years Survey of Parents, income is only available in bands, with the highest band set at £30,000+. Since median disposable income has been approximately £30,000 over the period we study we use the term ‘median income' as a rough shorthand to refer to these families (ONS, 2023b).
12It is possible that there may be some overlap between these two groups, but the extent of this is unclear.
6. References
Akhal, A, 2019, The early years workforce: a comparison with retail workers. London: Education Policy Institute.
Blanden, J, Del Bono, E, McNally, S and Rabe, B, 2016, "Universal pre-school education: the case of public funding with private provision", The Economic Journal, 126(592): pp 682-723. Available at: doi.org/10.1111/ecoj.12374.
Bonetti, S, 2020, Early years workforce development in England. London: Education Policy Institute.
Bonetti, S and Blanden, J, 2020, Early years workforce qualifications and children's outcomes. London: Education Policy Institute. Available at: epi.org.uk/publications-and-research/early-years-qualifications-and-outcomes/ (accessed 2 August 2023).
Brewer, M, Cattan, S, Crawford, C and Rabe, B, 2022, "Does more free childcare help parents work more?", Labour Economics, 74, p 102100. Available at: doi.org/10.1016/j.labeco.2021.102100.
Bustamante, A S, Dearing, E, Zachrisson, H D, Vandell, D L, 2022, "Adult outcomes of sustained high-quality early child care and education: do they vary by family income?", Child Development, 93(2), pp 502-523. Available at: doi.org/10.1111/cdev.13696.
DfE, 2022, Childcare and early years provider survey, reporting year 2022. London: Department for Education. Available at: explore-education-statistics.service.gov.uk/find-statistics/childcare-and-early-years-provider-survey/2022 (accessed 6 September 2023).
DfE, 2023, Education provision: children under 5 years of age, reporting year 2023. London: Department for Education. Available at: explore-education-statistics.service.gov.uk/find-statistics/education-provision-children-under-5 (accessed 4 September 2023).
Drayton, E and Farquharson, C. (2023). Early years spending update: Budget reforms and beyond. London: Institute for Fiscal Studies. Available at: https://ifs.org.uk/publications/early-years-spending-update-budget-reforms-and-beyond (accessed: 26 September 2023).
Drayton, E, Farquharson, C, Joyce, R, Waters, T, 15 March 2023, Childcare reforms create a new branch of the welfare state – but also huge risks to the market. Institute for Fiscal Studies press release. Available at: ifs.org.uk/news/childcare-reforms-create-new-branch-welfare-state-also-huge-risks-market (accessed 1 August 2023).
Farquharson, C and Olorenshaw, H, 2022, The changing cost of childcare. London: The Institute for Fiscal Studies (IFS). Available at: ifs.org.uk/publications/changing-cost-childcare.
Haux, T, Butt, S, Rezaian, M, Garwood, E, Woodbridge, H, Bhatti, S, Rogan, R W and Paul, G, 2022, The early years workforce: recruitment, retention, and business planning. London: Department for Education. Available at: www.gov.uk/government/publications/the-early-years-workforce-recruitment-retention-and-business-planning.
House of Commons Education Committee, 2023, Support for childcare and the early years: fifth report of session 2022-23. London: House of Commons. Available at: [publications.parliament.uk/pa/cm5803/cmselect/cmeduc/969/report.html#::text=In%202021%2F22%2C%20around%20%C2%A3,and%20%C2%A3894%20million%20respectively](https://publications.parliament.uk/pa/cm5803/cmselect/cmeduc/969/report.html#::text=In%202021%2F22%2C%20around%20%C2%A3,and%20%C2%A3894%20million%20respectively).
Jarvie, M, Shorto, S, Deer, L K and Goddard, E, 2023, Childcare Survey 2023. London: Coram Family and Childcare. Available at: familyandchildcaretrust.org/sites/default/files/Resource%20Library/Childcare%20Survey%202023_Coram%20Family%20and%20Childcare.pdf (accessed 1 August 2023).
Mathers, S, Ranns, H, Karemaker, A, Moody, A, Sylva, K, Graham, J and Siraj-Blatchford, I, 2011, Evaluation of the Graduate Leader Fund: final report. London: Department for Education. Available at: assets.publishing.service.gov.uk/government/uploads/system/uploads/attachment_data/file/181480/DFE-RR144.pdf.
Melhuish, E and Gardiner, J, 2021, Study of early education and development (SEED): impact study on early education use and child outcomes up to age seven years. London: Department for Education. Available at: assets.publishing.service.gov.uk/government/uploads/system/uploads/attachment_data/file/1029529/SEED_Age_7_Impact_Report.pdf.
NDNA, 2019, NDNA 2018-19 workforce survey England. Huddersfield: National Day Nurseries Association. Available at: ndna.org.uk/wp-content/uploads/2021/12/NDNA-Full-Workforce-Survey-Report-2018-2019-1.pdf (accessed 5 September 2023).
Nutbrown, C, 2012, Foundations for quality: the independent review of early education and childcare qualifications (Nutbrown review). Runcorn: Department for Education. Available at: assets.publishing.service.gov.uk/government/uploads/system/uploads/attachment_data/file/175463/Nutbrown-Review.pdf (accessed 2 August 2023).
OBR, 2023, Economic and fiscal outlook – March 2023. London: Office for Budget Responsibility.
Ofsted, 2022, The annual report of his majesty's chief inspector of education, children's services and skills 2021-22. London: Ofsted. Available at: gov.uk/government/publications/ofsted-annual-report-202122-education-childrens-services-and-skills/the-annual-report-of-his-majestys-chief-inspector-of-education-childrens-services-and-skills-202122 (accessed 5 September 2023).
ONS, 2021a, Births by parents' characteristics. Newport: Office for National Statistics. Available at: ons.gov.uk/peoplepopulationandcommunity/birthsdeathsandmarriages/livebirths/datasets/birthsbyparentscharacteristics (accessed 31 July 2023).
ONS, 2021b, Families and the labour market, UK. Newport: Office for National Statistics. Available at: ons.gov.uk/employmentandlabourmarket/peopleinwork/employmentandemployeetypes/articles/familiesandthelabourmarketengland/2021 (accessed 31 July 2023).
ONS, 2023a, Zipped population projections data files, England 2020-based interim edition of this dataset. Newport: Office for National Statistics. Available at: https://www.ons.gov.uk/peoplepopulationandcommunity/populationandmigration/populationprojections/datasets/z3zippedpopulationprojectionsdatafilesengland (accessed 4 September 2023).
ONS, 2023b, Average household income, UK: financial year ending 2022. Newport: Office for National Statistics. Available at: ons.gov.uk/peoplepopulationandcommunity/personalandhouseholdfinances/incomeandwealth/bulletins/householddisposableincomeandinequality/financialyearending2022 (accessed 4 September 2023).
Sylva, K, Melhuish, E, Sammons, P, Siraj-Blatchford, I and Taggart, B, 2004, The effective provision of pre-school education (EPPE) project: Findings from pre-school to end of Key Stage 1. Annesley: DfES Publications. Available at: dera.ioe.ac.uk/id/eprint/18189/2/SSU-SF-2004-01.pdf.
Women's Budget Group, 2023, Written evidence submitted by the UK Women's Budget Group to the Inquiry on support for childcare and the early years. London: UK Parliament. Available at: committees.parliament.uk/writtenevidence/116438/html/ (accessed 4 September 2023).
7. Appendix
In this appendix we provide additional details on the modelling underpinning the results in this report.
7.1 Childcare usage and total hours under each scenario
Appendix table 1 provides more detail on the results presented in section 2.2 detailing the average weekly hours spent in ECEC, and total increase in weekly hours under each scenario.
Appendix table 1: eligible population, average and total weekly hours in ECEC by 2028 under each scenario
| Scenario |
Age of child |
Average weekly hours (eligible) |
Average weekly hours (non-eligible) |
Change in weekly hours compared to current levels Total Increase |
% Change |
| Status quo |
1 |
12.3 |
1.1 |
-34,406 |
-1 |
| Status quo |
2 |
15.5 |
5.7 |
-112,600 |
-2 |
| Most likely |
1 |
17.0 |
1.1 |
1,636,217 |
46 |
| Most likely |
2 |
21.3 |
5.7 |
2,073,150 |
33 |
| High |
1 |
21.8 |
1.1 |
3,009,532 |
85 |
| High |
2 |
21.8 |
5.7 |
2,237,026 |
35 |
| Low |
1 |
13.9 |
1.1 |
733,889 |
21 |
| Low |
2 |
17.4 |
5.7 |
792,997 |
13 |
Table Notes: % change in hours compared to current levels is relative to total hours calculated using current average hours and the estimated numbers of one and two year olds in each eligibility category in 2023.
The first two rows in table 1 demonstrate that if the average hours in ECEC remained unchanged between now and 2028 there would be a very small decline in total ECEC hours across the one and two year old population. This is due to a small drop in the projected numbers of one and two year olds between now and then.
The next two rows show how formal childcare hours would change under what we believe to be the most likely scenario. Total hours spent by one year olds in formal childcare would rise by 46%, while total hours spent by two year olds would rise by 33%. This is driven by both an increase in hours among children in working families, and a shift in working patterns among families with at least one non-working parent in response to the policy.
Comparable figures for the low take up scenario are 21% for one year olds and 13% for two year olds. Under the high take up scenario, one year old hours would increase by 85% compared to current levels, while two year olds hours would increase by 45%.
7.2 Analysis of pay in the early years using Nesta's Open Jobs Observatory
This section provides further details on dataset and methods used to produce the results in section 3.2 of the report.
We investigate current trends in the early-years workforce by analysing online job postings data from Nesta's Open Jobs Observatory, a project to scrape, standardise and enrich job adverts from online job aggregator sites.
Identifying job adverts for each profession
We identify early-years professional (EYP) job adverts via a keyword approach. We identify groups of similar jobs ('professions') by first creating an initial list of job titles based on skill similarity profiles and expert advice. We then manually generate relevant job titles and query the database via a keyword approach.
EYP job adverts were identified using the following parameters:
- If the 'occupation' field matched with the EYP Occupation Titles list (see below)
- If the 'job title raw' field matched with the EYP Suggested Job Titles list (see below)
- If the 'profession' field contained the term 'Nursery'
- If the 'job title raw' field contained the phrase 'early years'