This report was produced by Nesta, Leeds City Council, Stockport Metropolitan Borough Council, the Greater Manchester Combined Authority and City of York Council.
Acknowledgements
Nesta, Leeds City Council, Stockport Metropolitan Borough Council, the Greater Manchester Combined Authority and City of York Council, would like to thank the parents, carers and early years practitioners across Leeds, York, Stockport and the Greater Manchester boroughs of Bolton and Trafford who took the time to speak with us. Their voices have been and will continue to be an essential foundation for our work.
If you'd like this publication in an alternative format such as Braille or large print please contact us at [email protected]
About Nesta
We are Nesta, the UK's innovation agency for social good. We design, test and scale solutions to society's biggest problems. Our three missions are to give every child a fair start, help people live healthy lives, and create a sustainable future where the economy works for both people and the planet.
For over 20 years, we have worked to support, encourage and inspire innovation. We work in three roles: as an innovation partner working with frontline organisations to design and test new solutions, as a venture builder supporting new and early stage businesses, and as a system shaper creating the conditions for innovation.
Harnessing the rigour of science and the creativity of design, we work relentlessly to change millions of lives for the better.
Find out more at nesta.org.uk
1. Executive summary
What would it take to close the disadvantage gap at age five?
In the UK, children from disadvantaged backgrounds start school on average four and a half months behind their more affluent peers on key child development measures.[^1] It is a gap which persists and widens throughout school years and into adulthood. A child who leaves school with few or no qualifications can expect to miss out on £100,000 of lifetime earnings[^2] and experience poorer health.[^3]
While the disadvantage gap in the early years narrowed in England between 2011 and 2017, it has since begun to widen slightly.[^4] The impact of COVID-19 on families and local services is expected to widen the attainment gap further.[^5],[^6] Despite a raft of initiatives by successive governments, including Labour's Sure Start and Healthy Child programme and the launch of the National Centre for Family Hubs earlier this year, the outcome gap in children's early years remains a persistent public policy challenge.
What would it take to eliminate the early years disadvantage gap in the UK? History tells us it cannot be achieved by any single organisation working in isolation. Among academic and policy experts, commissioners and practitioners, there is a consensus that the challenge requires a variety of actors working in partnership, with a deep understanding of specific local contexts and the time and space to explore systematic solutions. Unfortunately, the capacity for long-term thinking and innovation is often among the first casualties of budget cuts when frontline delivery is under strain.[^7]
Fairer Start Local was created to address this need. These partnerships bring together Nesta and local authorities in Leeds, Stockport and York, using a range of innovation methods to trial, adapt and improve services to support children in their early years.
This report summarises the partnerships' work so far, our ambitions for the future and the support Nesta hopes to provide to other local authorities intent on closing the outcome gap for disadvantaged children.
How can Fairer Start Local partnerships close the gap?
Fairer Start Local is a programme of innovation partnerships between Nesta and three local authorities. We have a shared commitment to make a measurable impact on outcomes for disadvantaged children, including their physical, cognitive, social and emotional development.
Each partnership combines the expertise of practitioners, policy and commissioning experts with deep expertise in innovation methods including data science, human-centred design and technology, behavioural science and experimentation. These methods support innovation that is grounded in local context and the lived experience of families. The partnerships will apply a test-and-learn approach to find solutions that work for families. Where we succeed, we will seek to share our work with other local authorities in our wider national network and support change at scale.
Our work so far
Between April and July 2021, Nesta ran three rapid discovery projects to test the concept of Fairer Start Local partnerships as a means of improving early childhood development outcomes. We wanted to find out if an innovation partnership approach could produce actionable insights to improve support for families in their children's early years, from conception to age five. This gave each project team an opportunity to experience working together and gauge whether there was fertile ground for a longer-term partnership.
The three project teams developed the following hypotheses to guide our work:
| City |
Hypothesis |
| Leeds |
If we could better understand who is and who isn't accessing services, we could listen to those families and learn how to better meet their needs and improve children's speech, language and communication outcomes. |
| Stockport |
If we could better understand what support parents want and how they want to access it, we could improve children's social and emotional development. |
| York |
If we knew the barriers to parents taking up services for two year olds, we could support more families and improve outcomes for two year olds. |
Table 1. Hypotheses to guide our work developed by our three project teams
Findings
Local partnerships proved a powerful approach. We found:
- A strong commitment among local partners to improving children's outcomes.
- A shared desire among service leaders to be data- and evidence-informed in how they planned early years services.
- Practitioners working in local services shared their passion for supporting families and their expertise in early child development.
- Local parents voiced a strong drive to support their children's development, and an interest in helping other families in their community.
The initial projects identified common challenges and opportunities for future work to strengthen local services and improve children's outcomes. Recommended areas for innovation include:
- Improving data infrastructure so that local authorities can more easily analyse the data they collect and use it to evaluate their services and target children in need effectively.
- Joining up data between health services, children's centres and early education provision, to support better co-ordination. If services can begin working towards the same metrics, they can build a shared understanding of desired outcomes and better co-ordinate interventions.
- Increasing service uptake in disadvantaged communities through identifying barriers to engagement, and understanding what services parents and carers would most value.
- Building the infrastructure to monitor service delivery in real time so that local authorities can make a robust assessment of the impact of interventions, target families in need and take an evidence-based approach to developing practice.
Having tried out these short-term partnerships and found this to be an effective way of working, all of the partners involved in the discovery projects (Nesta, Leeds, Stockport and the Greater Manchester Combined Authority and York) are committed to building a longer-term collaboration over the next three to five years. Through this partnership we will develop new ways of supporting families in the early years, and test whether they are successful in reducing the outcome gap for disadvantaged children.
Next steps
The new Fairer Start Local programme, launching in November 2021, will build on the opportunities identified in the discovery phase of work. Some of the shared priorities that Leeds, Stockport/GMCA and York have initially identified for this next phase of work include:
- Increasing families' engagement with service provision, particularly where children may be at higher risk of poor outcomes.
- Strengthening understanding of the impact of local service provision, through improved monitoring and evaluation.
- Improving the quality of services, such as early childhood education, parenting support and other services that support child development.
- Reviewing the interactions between universal and targeted services and the processes by which services identify families who may need additional support.
- Strengthening system integration to enable effective partnership working between services.
- Supporting families with some of the wider contextual drivers of poor child outcomes, such as low income or poor housing.
2. Introduction
From the moment of conception, the life trajectories of children in richer and poorer families begin to diverge. Children born into disadvantage are far more likely to experience poorer health, have lower adult earnings, live shorter lives and enjoy lower levels of happiness than their peers (University of York, 2020).
We know that supporting families in early childhood can improve outcomes for disadvantaged children.[^8] Yet progress to narrow the disadvantage gap in the early years has stalled and recently the gap even widened slightly[^9]. It is also expected that the impact of the COVID-19 pandemic on early years provision[^10] may have further contributed to a worsening of the attainment gap.[^11] There are numerous factors, including the fractured responsibility for national early childhood policy, fragmented service delivery, an overstretched early years workforce and a range of pressures on parents, which combine to leave too many children without the support they need in their early years.
Nesta's A Fairer Start Mission has the goal of eliminating the gap in outcomes between disadvantaged children and their peers, targeting the years between conception and when children start school. Most of the services and support that children and their parents receive during the early years is at a highly localised level, delivered through a combination of local authority, NHS, private and voluntary services. In the context of significant funding constraints, the early years sector lacks the capacity for service innovation to maximise the use of existing resources. By working with local services to apply innovation methods, Nesta can fill this gap. This might mean helping early years providers to make better use of their data, redesign their services, or improve the impact of their communications with parents.
Teams from Leeds City Council, City of York Council and Greater Manchester Combined Authority (GMCA) with Stockport Metropolitan Borough Council brought together local partners with a deep knowledge of their communities' specific needs and the existing support ecosystem. They were keen to work with Nesta to apply a range of innovation methods and explore how their offers could be re-designed, delivered and evaluated in ways that would have the most impact on outcomes for children.
Our shared aim for these rapid discovery projects was to create actionable insights that can be used to improve the design and delivery of services for families and monitor the impact of those changes on outcomes for children in their communities. Additionally, each team had the chance to trial this way of working in collaboration, before committing to a longer-term partnership.
2a Setting up the three Fairer Start Local partnerships
On 3 November 2020, Nesta put out an open call to local authorities across the UK to work in partnership on a three month trial discovery project. Through this process Nesta identified Leeds City Council, Stockport Metropolitan Borough Council/GMCA and City of York Council as local authorities that shared Nesta's vision and could see the value of working in partnership to use innovation methods to improve their early years offer.
Values and approach
Nesta and the three local area partners developed these trial discovery partnerships on the basis of shared values:
- A commitment to narrowing the outcome gap between children growing up in deprivation and the national average.
- A commitment to practice inclusive innovation and promote equity, diversity and inclusion (EDI).
- Participation of parents and carers in defining the problem and developing new solutions.
- Openness and transparency: sharing our working in the open and sharing learning with a wider network of peer local authorities.
These shared values will continue to frame our work as we develop a longer programme of work for A Fairer Start Local.
|
Leeds |
Stockport |
York |
| Percentage of children (under 16) in low income families (2019)[^13] |
22% |
15% |
13% |
| Percentage of children eligible for free school meals (FSM) reaching a good level of development (2019)[^14] |
48% |
46% |
53% |
| Percentage of children overall reaching a good level of development (2019)[^15] |
66% |
70% |
76% |
| p.p Gap difference between FSM-eligible children and non-FSM-eligible children reaching a good level of development[^16] |
23 |
27 |
25 |
| Number of children in primary school (2019)[^17] |
75,209 |
26,273 |
14,606 |
| Number of children claiming free school meals in primary school (2019)[^18] |
13,961 |
3,294 |
1,375 |
| Proportion of children in primary school with first language other than English (2021)[^19] |
22% |
11% |
9% |
| Life expectancy at birth (2017-2019)[^20] |
82.1 (f)
78.18 (m) |
83.29 (f)
79.83 (m) |
83.65 (f)
80.17 (m) |
Table 2. The three local areas in numbers
2b Focus of the work in each local area
The three 16-week discovery projects began in April 2021. Each followed the same rhythm of sprint working with regular meetings in a fortnightly cycle and several key touchpoints spaced throughout the timeline. Each of the three partners developed their own focus for their project.
York
In York the focus of the project was: "If we knew the barriers to parents taking up services for two year olds, we could support more families and improve outcomes for two year olds."
Our working hypothesis was that by improving take-up of the universal Health Review and targeted early years childcare offers for two year olds, this would contribute to narrowing the gap when children begin school.
To explore this hypothesis we:
- Undertook data analysis to better understand communities within the city and explore the interplay between geography and demographics with rates of take-up and children's outcomes.
- Engaged with families - via interviews and a text messaging survey – to better understand the barriers to take-up of health and childcare services and test alternative messaging and language for future communications from the council.
- Piloted a new service model for the Health Review for two year olds in one area of the city, working with the Healthy Child Service team and other professionals to design a more engaging, responsive and targeted service.
- Developed a prototype data dashboard for the city to enable ongoing use of real-time data (both quantitative and qualitative) and to allow service delivery to be more community responsive in the future.
Figure 1. York discovery phase timeline
This diagram illustrates the timeline of the York discovery phase, showing sprints and key activities.
Sprint 1 (Week 2):
* Kick-off Project planning
* Kick-off workshops
Sprint 2 (Week 4):
* Interviews with parents
* Data analysis
* Planning our evaluation
* Data sharing
* Engaging parents and stakeholders
Sprint 3 (Week 6):
* Designing and planning intervention to test
* Analysis and synthesis
* Ideation
Sprint 4 (Week 8):
Mid-point workshop (Week 10):
Sprint 5 (Week 10-12):
* Engagement sessions with Healthy Child Service team
* Surveying parents
* Pilot with North CC Healthy Child Service team
* Preparing text survey
* Behavioural Insights Team RCT coaching
Sprint 6 (Week 12-14):
Sprint 7 (Week 14-16):
* Build data dashboard
* Analysis and synthesis
Sprint 8 (Week 16):
* Final workshop
Stockport
In Stockport the focus of the project was on improving social and emotional development outcomes for children. Our hypothesis was: "If we better understand what support parents want and how they want to access it, we could improve children's social and emotional development."
Our work in Stockport involved:
- System and service mapping workshops with providers in the council and front-line practitioners to map out the full ecosystem of services and support.
- Interviews with parents to test how their experience of the support available to them lined up with the range of perception of professionals, and to understand the barriers and facilitators to accessing support.
- Data analysis to map out the impact of specific interventions, see what is working well, and identify times when children might benefit from additional support.
- Co-creation workshops with parents in Stockport and other local authorities within Greater Manchester, to imagine and develop new ideas to improve support for families, based on the challenges identified in the project. These prototypes will be piloted in Stockport in the future.
Figure 2. Stockport discovery phase timeline
This diagram illustrates the timeline of the Stockport discovery phase, showing sprints and key activities.
Sprint 1 (Week 2):
* Kick-off Project planning
* Kick-off workshops
Sprint 2 (Week 4):
* Data sharing
* Interview recruitment
* Planning
* Desk research
* Evaluation plans
Sprint 3 (Week 6):
Sprint 4 (Week 8):
* Data analysis begins
* Parent interviews and journey maps
Mid-point workshop (Week 10):
Sprint 5 (Week 10-12):
Sprint 6 (Week 12-14):
* Co-creation workshops with parents
* Early findings workshop
Sprint 7 (Week 14-16):
Sprint 8 (Week 16):
* Testing prototypes in wider Greater Manchester
* Final workshop
Leeds
In Leeds our initial working hypothesis was: "If we could better understand who is and who isn't accessing services, we could listen to those families and learn how to better meet their needs." We also decided to specifically focus the project on improving children's speech, language and communication outcomes.
To explore this hypothesis, we:
- Interviewed a range of practitioners who support families and children aged 0-5, to understand what services they provide to support children's speech, language and communication development. We also asked them about the strengths of current service delivery, as well as challenges.
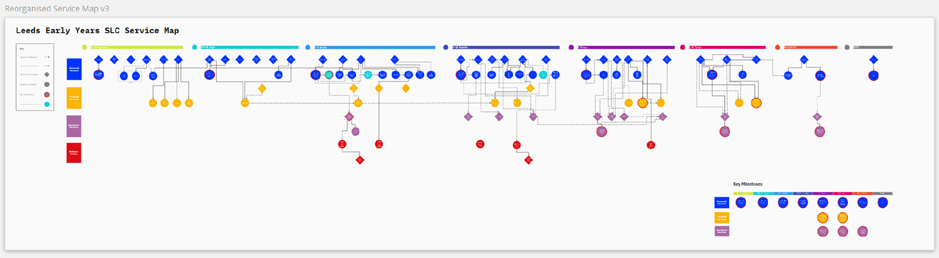
- Visually mapped the range of services that are currently on offer in Leeds and the connections between them.
- Analysed data on children's communication and language outcomes, as well as the take-up of the free entitlement to early education at age two, to see how this varies across the city.
- Interviewed parents and carers in an area of Leeds where a lower proportion of children are currently reaching expected language and communication development in reception year, to hear about how they support their children to learn, what types of services they use and activities they enjoy, and any challenges they face.
- Involved local professionals and parents and carers in developing some new ideas for services and activities that would support children's language and communication development.
Figure 3. Leeds discovery phase timeline
This diagram illustrates the timeline of the Leeds discovery phase, showing sprints and key activities.
Sprint 1 (Week 2):
* Kick-off Project planning
* Kick-off workshops
Sprint 2 (Week 4):
* Desk research
* Evaluation plans
* Data sharing
* Interview recruitment
Sprint 3 (Week 6):
* Practitioner interviews
* System mapping
Sprint 4 (Week 8):
* Qualitative analysis
* Data analysis
Mid-point workshop (Week 10):
Sprint 5 (Week 10-12):
* Parent/carer interview recruitment
* Parent/carer interviews
Sprint 6 (Week 12-14):
Sprint 7 (Week 14-16):
* Co-creation workshops with parents
Sprint 8 (Week 16):
* Final workshop
3. Applying innovation methods
The four main innovation methods Nesta brought to the trial discovery projects were data science, design, behavioural science and experimentation. Following initial workshops with each of the local areas, the project teams identified how these innovation methods might help to explore some of the challenges identified.
The project team in each local area then developed a bespoke project plan, drawing on combinations of these innovation methods, alongside qualitative research and desk research, to produce new actionable insights. Some examples of how we used these innovation methods in the discovery projects are set out below.
3a Data science
In all of the local areas, Nesta worked with local professionals to analyse existing early years datasets and produce new insights. Some of the data we looked at included:[^21]
- Children's outcomes in the Early Years Foundation Stage Profile (a measure of child development completed in reception year for all children in English schools).
- Children's ASQ (Ages and Stages Questionnaire) scores.
- Take-up of the Health Review for two to two and a half year olds.
- Take-up of the free entitlement to early education at age two.
Data work in York
In York the project aimed to overcome barriers to parents taking up services for two year olds, particularly focusing on the universal Health Review and targeted early years childcare offers for two year olds. We analysed data on current take-up of the two year old health review and learned that York performs well on children's outcomes compared with national and regional figures; around 94 per cent of children who receive a Health Review are at or above the expected level of development at age two. However, only around 73 per cent of parents are taking up the Health Review. This is a relatively low proportion compared with nearly 80 per cent nationally and 83 per cent regionally (in Yorkshire & the Humber). When we consider which children we know to be at the expected level of development (for example by analysing data for the full sample of families, including those who did not take up a Health Review), the proportion of children meeting this target reduces to 68 per cent.
We also analysed data on take-up of the Health Review in York both geographically and according to children's ethnicity (see below). This shows considerable variation in take-up across the city and for different demographic groups.
Figure 4. Take-up of the two- to two-and-a-half year Health Review in York
This visualization presents two main charts: "Take-up by area in York" and "Take-up by ethnicity in York".
The top chart is a map of York showing different areas with shaded regions indicating the percentage of attended two-year reviews. A legend indicates attendance percentages from 50% to 100%. Children's Centres are marked with dots. The map shows geographical variation in take-up rates.
The bottom chart is a horizontal bar chart titled "Take-up by ethnicity in York", showing "Percentage of children in the entirety of York who did not attend/attended (%)" for various ethnic groups. Each bar is divided into two segments: "Did not attend two year review" (orange) and "Attended two year review" (green).
Ethnicity Breakdown and Attendance (% Attended):
* Bangladeshi or British Bangladeshi: 50%
* Black, African, Caribbean, or Black British: 55%
* British or Mixed British: 65%
* Chinese: 60%
* Indian or British Indian: 70%
* Other: 60%
* Other White: 55%
* Pakistani or British Pakistani: 70%
* Unknown: 75%
* White British: 80%
* White and Asian: 85%
* White and Black African, White and Asian: 85%
The chart generally shows higher attendance rates for "White British" and "White and Asian" groups compared to some others like "Bangladeshi or British Bangladeshi" or "Other White".
This analysis led to further work to explore how take-up of the two year old health review could be improved among those groups not currently engaging (see more detail on this below).
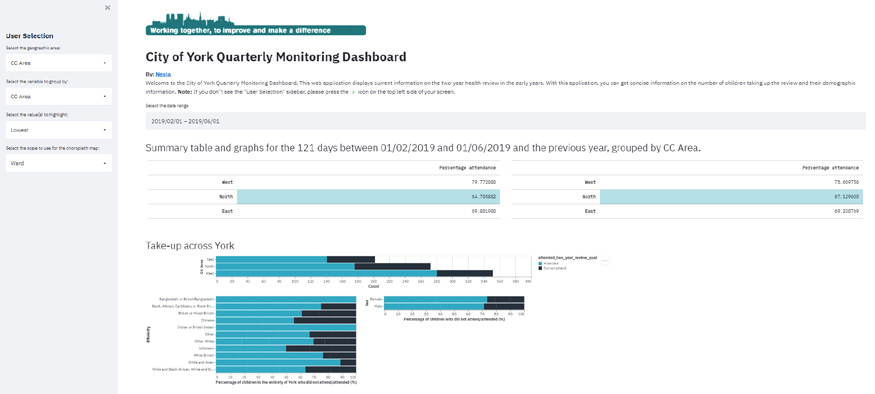
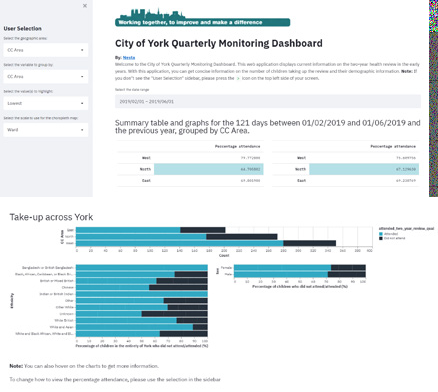
We also began work on creating a live data dashboard to enable quicker and easier analysis of service data by early years professionals in York. The data dashboard is a tool into which real-time data on the two year old health review can be fed, to enable service delivery to become more responsive to communities. The dashboard allows us to monitor service usage by showing take-up across different geographical areas and demographic groups over time. In the future it could be used to monitor risk factors, use data to target resources more efficiently, and systematically aggregate and monitor feedback from families about their service experience.
Figure 3 below shows a mock-up of how the data dashboard could look when it is fully operational.
Figure 5. Data dashboard
This image displays two screenshots of the City of York Quarterly Monitoring Dashboard. The first screenshot shows user selections, a summary table, and bar charts detailing attendance and take-up rates by CC Area and ethnicity. The second screenshot displays additional user selection options and various data visualizations, including bar charts on attendance and take-up across different demographics, illustrating how the dashboard could look when fully operational.
Data work in Leeds
The project team in Leeds had identified the aims of improving children's speech, language and communication outcomes and of understanding how to better meet the needs of families who are currently not accessing services. The starting point of this work was analysing data on children's communication and language outcomes in reception year, and breaking this down geographically by children's centre reach area (see map below). This provided a visual representation of how children's outcomes vary across the city, so that we could identify geographical areas where children were currently less likely to meet expected levels of development. We also analysed the proportion of families eligible for free early education at age two whose children were enrolled in childcare.
Through this analysis we identified Harehills as an area where there were fewer children meeting expected levels of development in communication and language, and where there was also lower take-up of funded early education. We made Harehills the focus of qualitative research with parents and design work to generate ideas for how we could improve support for children's communication and language development.
This is a choropleth map of Leeds showing "Percentage emerging" across different areas, ranging from 0-5% to 25-30%. The map visually represents how children's outcomes in communication and language vary geographically across the city.
In England in 2019,
17.8%
of children did not meet expected level in communication and language and
18.9%
in Leeds overall
|
Percentage of children not reaching expected level for communication and language |
Percentage take-up of free entitlement to early education at age two |
| Harehills |
27.1% |
26% |
| Swinnow |
25% |
84% |
| Meanwood |
21.3% |
78% |
| Armley Moor |
20.9% |
64% |
| Richmond Hill |
20.4% |
71% |
Figure 5. Proportion of children not meeting expected communication and language development at Early Years Foundation Stage (EYFS) by children's centre reach area (2019)
Data work in Stockport
In Stockport, the project team sought to establish the impact of existing family support services across the local authority.
Initially we looked at the paths children followed in the ASQ-SE (Ages and Stages Questionnaire - Social and Emotional Development), a screening tool that is used during health visitor appointments at several points in a child's early years. Looking at each ASQ-SE assessment, we found that 50 per cent of children who did not pass their first assessment then passed their second assessment. However, 17 per cent of children who did pass their first assessment then fell into 'did not meet the expected level of development' or were borderline for their second assessment.
Although this is a provisional analysis, this concerned Stockport practitioners as it indicates they may be missing some opportunities to identify children who would benefit from support. Following on from this analysis, the Stockport team are considering the possibility of introducing an interim assessment in an attempt to catch those children who are not continuing to meet their milestones.
Sankey Diagram x assessment outcomes (ASQ-SE)[^22]
This Sankey diagram illustrates the pathways children followed in ASQ-SE assessment outcomes. It shows the flow from an initial assessment (Passed 1, Borderline 1, Not meeting 1) to subsequent assessments (Passed 2, Borderline 2, Not meeting 2, Passed 3, Passed 4, Passed 5, Not meeting 3). The width of the bands represents the proportion of children following each pathway. For example, a significant portion of children who "Passed 1" continue to "Passed 2", while some from "Passed 1" move to "Borderline 2" or "Not meeting 2". Similarly, children from "Borderline 1" flow into "Passed 2", "Borderline 2", or "Not meeting 2". Those "Not meeting 1" primarily flow into "Not meeting 2". The subsequent stages lead to "Passed 3", "Passed 4", "Passed 5", and "Not meeting 3").
*Suppressed below 5
Figure 6. Sankey diagram representing the pathways children followed in the ASQ-SE[^22]
Through our data analysis and qualitative research with parents, we learned that in Stockport there are more family support services concentrated in the first few months of children's lives. Our analysis also found that improvements in children's outcomes tended to occur around the same time that interventions were generally in place. This can be seen in results related to children's development of fine motor skills. We saw a decline in fine motor skills as children get older, happening at the point at which fewer interventions are being provided. The team in Stockport have identified this as an avenue for potential further investigation, to explore the potential to extend their support offer for older age groups of children.
Figure 7. Mean fine motor ASQ-3 scores over age
This line chart shows "Mean fine motor ASQ-3 scores" on the y-axis (ranging from 30 to 60) against "Age period assessment taken (months)" on the x-axis (ranging from 0 to 55). The line generally shows fluctuations in scores. It starts around 50 at 0 months, rises to a peak around 58 at 10 months, then declines, reaching a low around 42 at 18 months, rises again to around 52 at 28 months, and then shows a general decline, ending around 34 at 55 months. This pattern suggests variations in fine motor skills over time, with a notable decline in later periods.
3b Design
Design work in Leeds
Following the initial data analysis and some qualitative research with practitioners in Leeds, we refined our original research question, so that the next stage of design work addressed the question:
Нош сап шеe engage with and meet the needs of families in Harehills who aren't currently engaging in activities that support their children's early language and communication?
Our main aims at this stage of the project were to deepen our understanding of the experiences of families in the Harehills area, and learn about parents' behaviours and challenges relating to their children's speech, language and communication development. We would use these findings to develop ideas for new solutions in collaboration with local parents and practitioners.
We recruited 13 local parents and interviewed them about their experiences of bringing up children in Harehills. Once we had interviewed all 13 parents, we carried out thematic analysis and also developed user journey maps (see Map 1) and relationship maps (see Map 2), to help visualise and understand their personal experiences, as well as their challenges with accessing support from local services. These maps were used to frame the conversations in two co-design workshops we ran with local parents and practitioners, to encourage the participants to empathise with the pain points experienced by parents and to think about solutions from their perspectives.
This map shows a family's experience of seeking help with their young child's language development. Some details were changed to protect the parent's anonymity. This map was used in the two design workshops to help introduce the participants to some of the challenges that parents experience in accessing support and the range of services they interact with.
A family's help-seeking journey
This diagram illustrates the emotional journey and activities of a family seeking help for their youngest child's language development. It maps "Emotion" (a fluctuating line graph indicating sentiment over time) and "Activity" and "People involved" against "Time" and a "Baseline".
The "Emotion" line shows a journey starting high, dipping, rising, dipping lower, rising slightly, and then consistently dipping again below the baseline.
The "Activity" and "People involved" sections show:
* Concerned about son's communication: Mother, Father, Son, Daughter
* Consults GP about issue: Mother, Father, Son, Daughter, GP
* GP refers to Health visitor: Mother, Father, Son, Daughter, GP, Health visitor
* Health visitor makes referral to school: Mother, Father, Son, Daughter, Health visitor, School, Family workers
* School assigns support worker to family: Mother, Father, Son, Other children, School
* Son enjoys interacting with other children at school: Mother, Father, Son, Other children
* Family still has concerns about son's language development: Mother, Father, Son, Daughter
* School and health visitor refer family to speech and language therapy: Mother, Father, Son, Daughter, Health visitor, Speech and language therapy
* Family on waiting list for speech and language therapy help: Mother, Father, Son, Daughter, Speech and language therapy
* Still on long waiting list for speech and language therapy: Mother, Father, Son
Map 1. A family's help-seeking journey
This map shows the network of relationships that one parent had in her community in Leeds. This is useful to help understand which organisations in her community this parent already interacts with and how she may wish to give and receive support from others. Alongside the map, some key information from the parent's story is summarised. Some details were changed to protect the parent's anonymity.
This map was used in the two design workshops to help participants think about the role that a range of services, organisations and community members might play in supporting children's communication and language development.
Relationship map
This diagram, titled "Relationship map", illustrates the network of relationships for a parent in the community. Key entities are represented as nodes, with lines indicating relationships. A legend defines different types of nodes and interactions: Family (red), Community (orange), Local groups (green), Education (light blue), Health services (purple), Relationship (grey line), Speech, language and communication interaction (dashed line).
Nodes include:
* Syrian Community Centre (Community)
* Volunteer worker (Community)
* Libraries (Education)
* College (Education)
* Children's Centre (Health services)
* School (Education)
* Husband (Family)
* Son, 19 (Family)
* Mother (Family)
* Daughter, 4 months (Family)
* Daughter, 16 (Family)
* Son, 15 (Family)
* Daughter, 9 (Family)
* GP (Health services)
* Migration services (Local group)
* Extended family (Family)
* Health visitor (Health services)
* Friends (Local group)
Relationships shown connect these entities, demonstrating how the family interacts with various services and community members. For example, the Mother is connected to her Husband, children, GP, Health visitor, Syrian Community Centre, and Libraries.
Map 2. Relationship map
Biography
Mrs Huda, 35, has recently moved to Leeds from Syria, having made the journey via Jordan and Turkey.
Family
She moved to Leeds with her husband and five children. Her oldest child is 19 and her youngest is four months old.
Languages
Her older children speak a mixture of Arabic, Tukish and English. She and her husband speak Arabic, but do not speak English.
Behaviours and habits
Her family is actively engaged with the Syrian Community Centre, which was her first port of call when she moved to Leeds.
She is not actively aware of, or engaged in, any other community activities.
As an experienced mother, other mothers often ask her for advice.
She likes to spend time with her four year old at the park, given COVID-19 restrictions.
We invited early years practitioners to the first design workshop to hear some of the findings from the interviews with parents. Practitioners thought about the challenges and barriers that parents were experiencing, as well as the parents' interests and behaviours, such as their high use of outdoor play areas. They then generated a range of ideas for supporting young children's speech and language development.
Figure 8. Practitioners' ideas for supporting early language and communication development
This figure presents a grid of six illustrated icons, each representing an idea from practitioners for supporting early language and communication development:
- Home learning packs for parents while they are on SLT waiting list: Illustrated by a stack of books.
- Pop-up tent in the park with games to support language development: Illustrated by a tent with a ball.
- Pop-up outdoor activities to get parents and children talking: Illustrated by a picnic table with an umbrella.
- Bring library buses to parks around Harehills and provide interpreters: Illustrated by a bus with books.
- Work with community groups to run sessions for new parents in their own language: Illustrated by two people talking, with speech bubbles.
- Train parents as communication champions in each community to provide peer support: Illustrated by a trophy with a Wi-Fi symbol.
- Flexible support on communication and language via text message: Illustrated by a text message bubble.
We invited parents and carers from Harehills to the second design workshop. Some of these parents and carers had participated in interviews previously and some were new to the project. At this workshop we also shared findings from the interviews and then invited the parents to generate their own ideas.
Figure 9. Parents' and carers' ideas for supporting early language and communication development
This figure presents a grid of six illustrated icons, each representing an idea from parents and carers for supporting early language and communication development:
- Pop-up tent in the park with games to support language development: Illustrated by a tent with a ball.
- Door knocking to ensure parents who aren't in touch don't miss out: Illustrated by a door with an open/closed symbol.
- Public space interventions to encourage help-seeking behaviour: Illustrated by a hand offering help.
- Integrate parent champions with local groups to deliver SLC tips specific to each community in Harehills: Illustrated by three people linked by a plus sign, with a trophy icon.
- Send outdoor activities for parents to engage with children's SLC via text: Illustrated by a cloud with a tree icon.
We also asked parents to give feedback on the practitioners' ideas. We found that there was an encouraging amount of overlap, but parents also highlighted the additional need for accessibility in services (including interpreters for non-English speakers), flexibility (as parents would need to fit any additional activities into busy lives) and continued access to specialist services, such as speech and language therapy, for those who needed them. These insights will inform future service improvement work in Leeds.
Stockport parent prototyping workshops
In Stockport, we brought together a group of parents we had spoken to during the interview stage for two online workshops, to co-design new sources of support that could meet some of the parental needs identified in our work. The parents developed two prototypes:
1. Toddler challenge
The problem
Parents lack sources of informal support and advice and places for their children to socialise with others.
The prototype
Structured play activities to support social and physical development would be led by a professional in a safe local outdoor space. The setting would allow parents to connect with support workers and peers while their children play.
2. Better communications service
The problem
Parents feel 'out of the loop' between health visitor appointments and can struggle to get advice quickly. There is no single place to go for information.
The prototype
A chatbot available anytime would enable parents to get advice quickly from a reliable source between appointments. It would notify parents of health visitor changes and key development milestones and signpost other sources of support and advice, with the ability to request appointments and refer on to in-person services.
We refined these prototype ideas with a broader group of parents. Using our project team's links with the other boroughs of the Greater Manchester Combined Authority, we were able to test them through parent workshops held in person at children's centres in Trafford and Bolton.
The Toddler Challenge will be piloted in Stockport in the coming months and will be shaped by feedback from parents and practitioners as the prototypes are tested in a real-world setting.
Ideas from the communications prototype will be fed into existing communications services, with the possibility of developing a chatbot function.
3c Behavioural science
Inviting parents to health reviews in York
The project team in York had identified the goal of increasing take-up of Health Reviews for two year olds. They decided to use insights from behavioural science to develop and test a new approach to inviting parents and carers to attend. The team drew on the EAST framework developed by the Behavioural Insights Team (BIT, 2014).[^23]
Behavioural science tells us that people are more likely to do something if it is Easy, Attractive, Social and Timely (EAST). These principles were applied to this intervention in the following ways:
- Easy: minimising the hassle or 'friction cost' to parents of making a Health Review appointment.
- Attractive: personalising the letter to the child.
- Social: making use of social norms – most people prefer not to break a commitment by not attending an appointment.
- Timely: encouraging parents to make a specific plan to attend the Health Review.
In the pilot, we changed the default for the Health Review appointment from an 'opt-in' model to an 'opt-out' model. Previously parents would have received a letter inviting them to 'opt-in' to an appointment, and they would then have to call and arrange a time. The new 'opt-out' letter would invite parents to a pre-booked appointment. If they didn't want to attend, they would need to call the Healthy Child Service to rearrange or cancel. By removing the administrative burden of signing up, the Healthy Child Service could potentially reach more parents who might otherwise forget to book an appointment. Both letter A (the previously used 'opt-in' letter) and letter B (the new 'opt-out' letter) are included in the appendix.
The new letter was then piloted in the York North children's centre reach area. Initial findings were positive; during the month of the pilot, when the new letter was being used, nearly 70 per cent of children invited to an appointment in York North were brought to their appointment, compared with 43 per cent of children invited in York West and 18 per cent of children invited in York East, where the old version of the letter was being used.
As there were only small samples of parents involved, with between 22-45 children being invited to their Health Review in each children's centre reach area, it was not possible to run a randomised controlled trial as part of this experiment (the sample size would have been too small to generate statistically significant findings). While these results are promising, it cannot be assumed that it was the new 'opt-out' letter that led to improved take-up of appointments in York North compared with York East and York West. However, given that the initial findings of the pilot project indicated some positive changes in appointment attendance, both Nesta and York would be interested in continuing this work and potentially evaluating it with a randomised controlled trial in the future, to create stronger evidence of its impact.
Surveying parents by text message in York
The project team in York also piloted text messaging surveys as a new method of gathering rapid feedback from parents and building an evidence base to inform future communications. Forty six parents responded to a 12-question survey, during which we explored some of the topics parents would most like advice on from health visitors and their motivations for attending or not attending the two-year health check. The team was then able to feed some of the findings from this survey into developing future communications with parents.
We learned through this survey that parents preferred the messages that emphasised the child health benefits of health reviews, as well as the qualifications of the nurses involved, rather than the messages that emphasised social norms.
Figure 10. Findings from the text message survey
This bar chart, titled "Which sentence would make you most likely to take your child for the two year old health review?", displays the percentage response for three categories: "Health visitor qualifications", "Health benefits", and "Social norm".
- Health visitor qualifications: 44.1%
- "Did you know health visitors are fully-trained nurses?"
- Health benefits: 41.2%
- "Did you know the two-year old health review can help with sleeping and tantrums?"
- Social norm: 14.7%
- "Did you know that before the pandemic over 70 per cent of children in York went for their two-year old health review?"
The chart indicates that messages emphasizing health visitor qualifications and health benefits were significantly more persuasive than those focusing on social norms.
Through trying out this new engagement method, we learned that communicating with parents via text message is a promising avenue for future work. Over half of the parents involved agreed to be contacted again in future and three-quarters said they would prefer to receive future updates about health appointments via text.
Due to the rapid nature of this project we did not obtain demographic data about the parents who took part in the text messaging surveys. It is therefore possible that they included parents who had already taken up a Health Review. In the future it would be valuable to do further work exploring the value of text messaging specifically with parents who had not taken up their child's Health Review. This would help us to better understand this group of parents and which messages they respond to most positively.
4. What we learned
Through these projects, the local partnerships learned about the many strengths and resources that currently exist in the three local areas, which can be built on in future work.
These included:
- A strong commitment among all local partners to improving children's outcomes. This inspired an open-minded willingness to interrogate and challenge existing practice and experiment with new ways of working.
- The desire among service leaders to be data-driven and evidence-informed in how services are planned and evaluated.
- A rich local offering of early years services from pregnancy onwards, with many passionate and knowledgeable professionals working with families to support children's development.
- A range of voluntary and community organisations with strong relationships with local parents and carers. In Leeds we started to learn about the potential to build on these relationships to reach parents and carers who were not currently engaging in council-run services, including those who were speakers of English as an additional language.
- Parents and carers who have a strong drive to support their children's development; some also talked about their role in helping other families in their community.
As well as these many strengths, there were also challenges and opportunities for improving local services. Due to the short timescales of the projects, it was not possible to tackle all of these areas in one project, but we look forward to incorporating the learnings in future Fairer Start Local projects.
Some of these opportunities for future work include:
1. Improving data infrastructure so that local authorities can analyse the data they collect and use it to evaluate their services and target children in need effectively
The data analysed in these projects about service use and children's outcomes provided useful insights for the local teams and often informed the trajectory of the project work. However, services use a variety of metrics and methods to collect and store data, which is a challenge for evaluation. In the future there may be opportunities to link more datasets, including health data and children's services data, to allow for a more detailed analysis of the intersection of those characteristics which can lead to families not accessing services. For example, it would be useful to know whether the families who are not accessing the Health Review for two year olds are also not taking up the childcare offer. By identifying children who may be at risk of poorer outcomes earlier, we can help services to provide interventions at vital points in children's development, as well as better target support towards those families who are most in need.
2. Supporting improved co-ordination between local services
When a wide range of services from different providers are available for children, systems can become challenging for service users to navigate. Common tools for assessing children's development, and a shared language for practitioners, could facilitate better co-ordination between services and more consistency in how we work with families.
In this project we witnessed practitioners sharing their knowledge of the different services on offer, and how closer relationships between service providers can lead to stronger local collaboration. By continuing these conversations, and by sharing data which allows children to be supported more consistently across local services, we can make it easier for families to access the support they need for their children.
3. Building capacity for engaging with families, to help increase the take-up of services in disadvantaged communities
The data analysis conducted throughout this work often reinforced what we were being told by practitioners who work directly with families. It was no surprise to local practitioners that families living in more disadvantaged and minoritised communities were less likely to take up universal services such as the health check for two year olds, as well as targeted services such as the free entitlement to early education at age two. However, the solution to this challenge is not always straightforward and a deeper level of engagement with families will be needed to better understand their motivations, as well as the barriers to them taking up services.
In all three local authority areas, partners were keen to improve their practice and infrastructure for engaging with local families, to understand more about what kinds of support parents and carers would value and how current services could be improved. Interviews with professionals identified this wish to increase "insight at community level – i.e. what do parents want and need?" A professional from one local area commented that "It's easy to talk to those already engaged in multiple ways – but still not reach the most disadvantaged". There were particular challenges posed by rapidly changing demographics, particularly within some of the most disadvantaged communities. More time was needed to build links with these newer communities, including families who had recently emigrated to the UK. Fairer Start Local aims to develop a deeper understanding of these families' experiences and values so we can respond effectively and ensure these families are engaged as quickly as possible.
4. Building the infrastructure to monitor service delivery in real time
In all three local areas, service leaders wanted to increase their capacity to take data-driven and evidence-informed decisions. Managers running local services thought that the infrastructure for monitoring service delivery, and understanding whether services were achieving their intended impact, could be improved. In one local area, they wanted to find out: "Why do we have 'good' services, but poor outcomes at EYFS?"
In the next stage of our work, the Fairer Start Local partnerships will seek to strengthen the infrastructure for monitoring services in each area, so that local authorities can robustly assess interventions, target families in need and pursue an evidence-informed approach to developing practice.
5. Fairer Start Local: future plans
The three discovery projects enabled the local partnerships to learn more about actions that could help to close the outcome gap for disadvantaged children in Leeds, Stockport/GMCA and York. We gained insight into a range of opportunities for increasing the effectiveness and reach of local services.
Having tried out these short-term projects in partnership and found it an effective way of working, all four partners (Nesta, York, Stockport/GMCA and Leeds) have decided to progress to a three to five year collaboration.
We are now exploring shared priorities for A Fairer Start Local, which we will tackle over the next three to five years. Some of the shared priorities we have initially identified include:
- Increasing families' engagement with service provision, particularly where children may be at higher risk of poor outcomes.
- Strengthening understanding of the impact of local service provision, through improved monitoring and evaluation.
- Improving the quality of services, such as early childhood education, parenting support and other services that support child development.
- Reviewing the interactions between universal and targeted services and the processes by which services identify families who may need additional support.
- Strengthening system integration to enable effective partnership working between services.
- Supporting families with some of the wider contextual drivers of poor child outcomes, such as low income or poor housing.
Over the next three to five years the Fairer Start Local partnerships will co-design new approaches to narrow the outcome gap between children born into deprivation and their peers. We will do this with practitioners and communities and evaluate their impact on outcomes for children and their families. Where the partnerships identify promising practices and solutions, we will seek to sustain, embed and scale them up. We look forward to sharing our learning as we embark on this journey together.
6. Appendices
Appendix A: innovation methods glossary
Behavioural science
Behavioural science involves working closely with people to understand their views and preferences, to ensure that interventions are grounded in the experiences of the people they are aimed at. Where we hope to change the behaviour of parents or practitioners, our interventions are shaped by our understanding of what drives people to take decisions and behave in certain ways, making our interventions more likely to succeed.
Data science
Data science involves analysing large amounts of data to derive insights that may not be visible in other ways. Using a variety of sources (official, open source, internal data shared by partners), we can transform the data by cleaning it, enriching it with additional information and identifying patterns through machine learning and statistical methods. Our outputs include: new findings, interactive visualisations, data products and services, open source software and data that other people can use in their own work.
Design
Design: good design means ensuring that services are easy to access and offer users a positive experience as well as improving their outcomes. It is about designing, building and testing solutions that meet people's needs and deliver the intended impact. It can include social innovation, service design, user experience design, product design, software development and product management.
Experimentation
Experimentation is a research method that helps us to test different interventions and approaches to find out whether they work to achieve particular outcomes. Experiments let us try out new approaches (such as communications, services or products) in practice and then refine and improve them over time to increase their impact.
Appendix B: practical innovation resources
Appendix 1
York Letters A and B: York's 'business as usual' letter inviting parents to book their child's two year old health review (Letter A), and the new 'opt-out' letter that was piloted (Letter B).
Appendix 2
The Behavioural Insight Team's Barrier identification tool (based on the COM-B model).
Appendix 3
Simple ways to apply behavioural insights (EAST).[^23]
Appendix 4
Summary of the texting service used in York.
The service we used to set up the text messaging service in York is called FireText. It allowed us to collect responses from 46 participants in the space of a week, recruited through a mix of professional referral and online advertising on local parent forums.
Parents texted an assigned number to sign up and then received a 12-part survey. When they replied to one message, they would automatically receive the next one.
We found that the survey method worked best for multiple choice and short answer questions. These are the easiest to analyse and therefore capitalise on the large sample size that surveys can reach, while open-ended questions might run into barriers such as low literacy rates or participant fatigue.
Appendix C
Nesta's Early Years Innovation Partnership: eligibility criteria.
Appendix 5
Six Thinking Hats ideation exercise.
Appendix 6
Leeds early years speech, language and communication service map.
The service map we created for Leeds can be accessed in Miro.
Figure 11. Leeds early years speech, language and communication service map
Endnotes
- Jo Hutchinson, Sara Bonetti, Whitney Crenna-Jennings and Avinash Akhal, Education in England: Annual Report 2019 (London: Education Policy Institute, July 2019), epi.org.uk/wp-content/uploads/2019/07/EPI-Annual-Report-2019.pdf.
- Hugh Hayward, Emily Hunt and Anthony Lord, The economic value of key intermediate qualifications: estimating the returns and lifetime productivity gains to GCSES, A levels and apprenticeships (Department for Education, December 2014), assets.publishing.service.gov.uk/government/uploads/system/uploads/attachment_data/file/387160/RR398A_-_Economic_Value_of_Key_Qualifications.pdf.
- OECD, Equity and Quality in Education. Supporting Disadvantaged Students and Schools (Paris: OECD Publishing, 2012), oecd.org/education/school/49620025.pdf.
- Jo Hutchinson, Sara Bonetti, Whitney Crenna-Jennings and Avinash Akhal, Education in England: Annual Report 2019 (London: Education Policy Institute, July 2019), epi.org.uk/wp-content/uploads/2019/07/EPI-Annual-Report-2019.pdf.
- Education Policy Institute, Preventing the disadvantage gap from increasing during and after the Couid-19 pandemic: proposals from the Education Policy Institute (London: Education Policy Institute, May 2020), epi.org.uk/wp-content/uploads/2020/05/EPI-Policy-paper-Impact-of-Covid-19_docx.pdf.
- Chris Pascal, Tony Bertram, Carl Cullinane and Erica Holt-White, COVID-19 and Social Mobility Impact Brief #4: Early Years (London: The Sutton Trust, July 2020), www.suttontrust.com/wp-content/uploads/2020/06/Early-Years-Impact-Brief.pdf.
- WAITING FOR CORRECT LINK
- Gwyther Rees and Jonathan Bradshaw, Children's Worlds National Report: England (York: Social Policy Research Unit, University of York, July 2020), isciweb.org/wp-content/uploads/2020/07/England-National-Report-Wave-3.pdf.
- Deborah Fitzsimmons et al., 'The Family Nurse Partnership to Reduce Maltreatment and Improve Child Health and Development in Young Children: The BB:2-6 Routine Data-linkage Follow-up to Earlier RCT', Public Health Research 9, no. 2 (2021): 1-160, cronfa.swansea.ac.uk/Record/cronfa56228/Description#tabnav.
- Jo Hutchinson, Sara Bonetti, Whitney Crenna-Jennings and Avinash Akhal, Education in England: Annual Report 2019 (London: Education Policy Institute, July 2019), epi.org.uk/wp-content/uploads/2019/07/EPI-Annual-Report-2019.pdf.
- Nesta, New reception pupils are the 'least school-ready' for generations (London: Nesta, September 2022), nesta.org.uk/press-release/new-reception-pupils-are-the-least-school-ready-for-generation.
- Chris Pascal, Tony Bertram, Carl Cullinane and Erica Holt-White, COVID-19 and Social Mobility Impact Brief #4: Early Years (London: The Sutton Trust, July 2020), www.suttontrust.com/wp-content/uploads/2020/06/Early-Years-Impact-Brief.pdf.
- 'Local Authority Interactive Tool (LAIT)', Department for Education, last modified 5 August 2021, accessed September 2021, gov.uk/government/publications/local-authority-interactive-tool-lait.
- 'Local Authority Interactive Tool (LAIT)', Department for Education, last modified 5 August 2021, accessed September 2021, gov.uk/government/publications/local-authority-interactive-tool-lait.
- 'Local Authority Interactive Tool (LAIT)', Department for Education, last modified 5 August 2021, accessed September 2021, gov.uk/government/publications/local-authority-interactive-tool-lait.
- 'Local Authority Interactive Tool (LAIT)', Department for Education, last modified 5 August 2021, accessed September 2021, gov.uk/government/publications/local-authority-interactive-tool-lait.
- Department for Education, Schools, Pupils and their Characteristics (DfE, 2019).
- Department for Education, Schools, Pupils and their Characteristics (DfE, 2019).
- 'Local Authority Interactive Tool (LAIT)', Department for Education, last modified 5 August 2021, accessed September 2021, gov.uk/government/publications/local-authority-interactive-tool-lait.
- 'Life Expectancy by Local Authority' (Age group 00-01, Time 2017-2019), ONS, November 2020, ons.gov.uk/datasets/life-expectancy-by-local-authority/editions/time-series/versions/1.
- There was some variation between the three local authorities in what data we could access and analyse within the project timescales. We were not able to analyse all of these data sources in all three areas.
- We simplified their journey to Passed 1, Passed 2 etc. with Passed 1 representing the first assessment they took, and Passed 2 representing the next assessment.
- Owain Service, Michael Hallsworth, David Halpern, Felicity Algate, Rory Gallagher, Sam Nguyen, Simon Ruda, Michael Sanders with Marcos Pelenur, Alex Gyani, Hugo Harper, Joanne Reinhard and Elspeth Kirkman, EAST: Four Simple Ways to Apply Behavioural Insights (London: The Behavioural Insights Team, 2014), www.bi.team/publications/east-four-simple-ways-to-apply-behavioural-insights.
58 Victoria Embankment
London EC4Y ODS
+44 (0)20 7438 2500
[email protected]
@nesta_uk
nesta.uk
www.nesta.org.uk
Nesta is a registered charity in England and Wales with company number 7706036 and charity number 1144091. Registered as a charity in Scotland number SC042833. Registered office: 58 Victoria Embankment, London EC4Y ODS.