Foreword
Learning is at the centre of everything we do at HegartyMaths. For Colin and me, HegartyMaths has always been about understanding our learners, their needs and what motivates them – then building a platform that supports unstoppable learners!
As such, when we got the opportunity to work together with our colleagues at Nesta and the Behavioural Insights Team, it was too good to turn down. It was an opportunity for us to learn and to challenge our beliefs about how our students behave on HegartyMaths.
Over the course of the project, our team got first-hand experience in the use of behavioural insights to improve our platform, help our users get more value and, ultimately, improve outcomes for students and teachers. Not only did we learn about the theory of behavioural insights but also how to apply it to HegartyMaths. Over a very short period of time, we worked with new technologies and applied behavioural insights to our platform following BIT's TEST framework. We ran experiments, conducted data analysis and learned about what works, but also what doesn't work!
It was a fantastic experience that threw up a few surprises. It showed us how important it is to think through how we present choices and design new features, and the importance of testing. Even though the project has ended, this approach will be valued and used in our work practices from here on. In meetings, I now regularly hear the phrase,
"Can we apply behavioural insights to that?!"
Simply put, we will not be looking back.
Brian Arnold, Co-Founder, HegartyMaths
September 2020
Introduction
This how-to guide outlines how to apply behavioural insights, underpinned by a data-driven approach, to improve learning outcomes on EdTech platforms.
It was co-developed by Nesta, the Behavioural Insights Team (BIT), and HegartyMaths, following collaboration that involved applying behavioural insights to HegartyMaths – one of the most widely used EdTech platforms in the UK.
What are behavioural insights?
Behavioural insights (BI) are ideas from psychology and economics that explain why people behave the way they do and help encourage positive behaviours. Behavioural interventions often include simplification, personalisation and comparisons with social norms. For example:
Why apply behavioural insights in EdTech?
Applying behavioural insights can be a low-cost way to improve product effectiveness because small changes in how information or choices are presented can have an outsized impact on behaviours. For example:
- Sending disadvantaged pupils a letter from a similar student encouraging them to apply to university boosted applications by 34 per cent.
- Simplifying teacher application forms tripled applications for rural placements.
For EdTech platforms, behavioural insights are particularly critical because platform design is central to the student's experience of learning and is responsible for supporting and motivating the student to learn.
In parallel, the online nature of EdTech platforms provides an easily accessible testing environment in which to experiment with behaviourally informed solutions – giving an opportunity to make meaningful, measurable improvements.
Results from HegartyMaths' application of behavioural insights
- A behaviourally informed pop-up message more than doubled the number of students accessing help when they answer a question incorrectly, and improved student accuracy across the platform.
- Changing the default from opt-in to opt-out on a new feature boosted the number of students using the feature by 42 per cent.
- Providing students with the opportunity to set up a 'streak' led to lower student engagement on the platform, with time spent on the site, videos watched, and new questions answered correctly all lower for the trial period.
Why now?
The COVID-19 pandemic has led to school closures worldwide, with the possibility of further closures in the future. While the use of EdTech platforms was growing substantially before the pandemic, many more teachers and students are relying on these products to continue learning in this difficult time. In view of this, we believe that applying behavioural insights to EdTech platforms right now (May–September 2020) – especially to influence behaviours that are particularly important for students during school closures, such as self-motivation and independent learning – has the potential to benefit very large numbers of students.
What's in this guide?
The rest of this guide is split into the following sections, based on the four stages of running a behavioural insights project:
- Target: How to identify challenges that a behavioural insights approach can address.
- Explore: Guidance on conducting exploratory research.
- Solution: BIT's framework for generating behavioural insights solutions, and examples of how these could be applied in EdTech.
- Trial: The importance of testing, and examples of recent tests completed with HegartyMaths.
- Next steps
These stages are described in greater detail below. Throughout this guide, we also provide case study examples of how this process was applied in a recent project with HegartyMaths.
The four stages to running a behavioural insights project
Target
Purpose: Choose specific behaviours to change. These should be behaviours that improve learning outcomes for students (e.g. students completing more questions, students watching more videos).
Output: Target statements with measurable outcomes. To know if our BI Solutions work, we need to be able to measure the behaviour.
Solution
Purpose: Design behavioural Solution(s) to change your chosen behaviours. We recommend using BIT's digital EAST cards to generate Solutions. You can get free access to these cards by using the password 'eastcards'.
Output: Behavioural Solution(s) that can be implemented and trialled. You should select the specific Solution(s) to trial by thinking about how likely it is to significantly improve student outcomes (impact), and how easy it is to implement (feasibility).
Explore
Purpose: Build your understanding of the context in which your chosen behaviours take place, and possible behavioural barriers. This will almost always involve interviewing teachers, as well as your own staff.
Output: Insights to help you create an effective Solution to change your chosen behaviour. For example, teachers may suggest that 'students often forget to watch the teaching videos', in which case reminding students to do this might be helpful.
Trial
Purpose: Find out if your proposed behavioural Solutions work. Sometimes things we think will work don't make a difference, often for surprising reasons. Trialling our ideas allows us to check for this.
Output: Develop the infrastructure within your organisation to conduct rapid A/B tests, and then test your Solutions – this is often much simpler than you may think.
01 Target
The first step in applying behavioural insights to your platform is to identify measurable behaviours that you would like to improve.
1.1 Identifying important behaviours
A helpful way to start thinking about this is to consider how your tool achieves impact. 'Improving learning' may be your end goal, but this is too broad for a targeted intervention. Which particular features or activities are central to positive user outcomes? The behaviours relating directly to these touch points are a good place to start. For example, this could include 'completing more learning activities' or 'answering more questions correctly' for students, or 'downloading more reports' for teachers.
A way to begin identifying these key behaviours is to focus on your organisation's broader strategic goals. For many EdTech organisations, these will include improving student engagement, motivation and learning. Think about why this is a goal for your organisation and how you think it is related to improved educational outcomes.
Once these are identified, narrow in on specific behaviours that a student should adopt for you to achieve these goals. For example, for HegartyMaths one of our areas of focus was encouraging students to watch videos, which are central to the platform. Targeting specific behaviours will enable deeper understanding of the barriers and drivers of change.
Finally, prioritise behaviours based on importance and feasibility. Consider:
- Importance – how much does this impact your end goals? Would a student behaving like this be more likely to learn more effectively? Does the behaviour relate to most students or teachers on the site or just a small group? What evidence is there that this behaviour supports your end goals?
- Feasibility – how hard is the behaviour to change? Is it deeply entrenched? Are there structural barriers such as a lack of access to appropriate technical equipment or time-stretched teachers that you cannot address with a behavioural insights intervention?
In the next pages are some examples of common EdTech goals and related behaviours to consider.
HegartyMaths' case study: SMART Targets
We looked at all sorts of things in the target phase... it was helpful to determine which behaviours we thought could really make a difference.
Brian Arnold, HegartyMaths
With HegartyMaths, we prioritised three behaviours that we hoped to change. These SMART Targets were:
- Increase the proportion of students clicking the 'Get Help' button after answering a question incorrectly from 10.2 per cent to 20 per cent by the end of the summer term.
- Increase the proportion of correct first attempts from 71.1 per cent to 72 per cent by the end of the summer term.
- Increase the number of MemRi quizzes (a new feature on the platform) completed per week by 30,000 by the end of the summer term.
1.2 Defining your Target outcomes
To evaluate whether you achieved your Target, you will need to define an 'outcome measure'. Many EdTech companies will want to focus on improving learning, but this can be difficult to measure, and so it may be necessary to identify proxies that best capture 'learning progress'. For example, this could be student accuracy on similar questions measured over time. This could be done using data that is already collected on a routine basis – such as activity completion rates or time spent on the platform. In some cases, you might realise that the information you really need is not currently being measured.
Getting as specific as possible is critical for accurate evaluation. We recommend making your Target outcomes SMART, i.e. Specific, Measurable, Achievable, Realistic, Timely (see case study examples on the left).
Table 1 Common EdTech goals and related behaviours
| Areas where behavioural insights can be impactful |
Examples of specific behaviours to target |
| Engagement |
Spending time on the site (for students and teachers) |
|
Completing activities/ questions (students) |
| Motivation |
Completing assignments (students) |
|
Completing independent learning activities (students) |
| Learning progress |
Making progress across quizzes/ tests (students) |
|
Answering questions correctly (students) |
02 Explore
The second step in applying behavioural insights to your platform is to better understand how students and/or teachers currently behave on your platform and why. This helps to identify drivers and barriers to your Target behaviours.
The reasons that students and teachers behave the way they do may be different from what you expect. Sometimes they will tell you if you ask. Other times they may not be aware of their own behaviour and you can best understand it by observing them. Three key activities to complete are:
- Listening to teachers, parents and staff in semi-structured interviews to explore their views, experiences, emotions and motivations. Speaking with teachers and parents may provide insight on how students engage with the platform, and what behavioural barriers they may face. Staff in your organisation will also have important perspectives – for example, customer support staff will know the challenges that teachers most frequently complain about. Most of the time, 5–10 interviews will be enough. We recommend asking open questions (i.e. questions that allow teachers to tell a story), rather than closed questions (i.e. questions that can be answered with yes/no, a number, etc.).
- Understanding how students, teachers and parents experience your system. You may want to observe users directly as they experience the system – for example, by using mouse tracking software. This will help you to understand the moments at which students 'drop off' or leave a process.
- Analysing existing data to explore relationships, patterns and trends surrounding your behaviour of interest. You might want to think about the following:
- How does your chosen behaviour vary over time? Does the behaviour start off well and then 'tail off', suggesting a reminder might be helpful?
- What do you notice about your 'best' and 'worst' students or teachers for your chosen behaviour?
- What other behaviours might predict your chosen behaviour? For example, does consistent usage by students depend on consistent work setting by their teacher?
In the case study on the next page, we outline the Explore activities that we completed with HegartyMaths and what we learnt.
Case study: Exploring 'Get Help'
Getting teachers to participate in interviews is important for gathering insights into how they see and feel things when using technology.
Brian Arnold, HegartyMaths
A challenge identified by HegartyMaths staff was that too few students were clicking on the 'Get Help' button after incorrectly answering a question. The 'Get Help' button takes a student through to a video that shows them how to answer a similar question, and is designed to support them when they have answered a question incorrectly.
To explore the issue further we interviewed teachers and HegartyMaths staff, completed key activities on the site ourselves, and explored existing data.
Below are key learnings from each activity:
- Insights from listening to teachers and staff
- HegartyMaths staff perceived the 'Get Help' button, and the associated teaching videos, as a 'key driver of success' on the platform, but thought students may not be fully aware of their benefits. The feature was described as being the closest thing you could get to having a teacher standing beside a student, helping them if they made a mistake.
- Insights from experiencing the system ourselves
- When answering questions ourselves, we felt that the importance of watching videos could be made more salient to students. Students who answer a question incorrectly are shown a pop-up encouraging them to check their answers. While some mistakes are caused by calculation errors, others are due to a lack of understanding – which could be addressed if the student clicked 'Get Help' and watched the video. This was not entirely clear.
- Insights from analysing existing data
- We found that the 'Get Help' button and associated videos were effective, but underused. Analysis of HegartyMaths data showed that video watch correlated strongly with answer accuracy. However, on average students only watched videos assigned to them 8 per cent of the time, which was in line with what we heard from users and staff.
03 Solution
The third step in applying behavioural insights (BI) to your platform is to develop Solutions, or intervention ideas, that could help you achieve the Targets you identified in Stage 1 – drawing on what you discovered when exploring the issue in Stage 2.
3.1 Generating ideas
The Behaviour Insight Team (BIT)'s EAST framework highlights that if you want to encourage a behaviour, a good place to start is to make it Easy, Attractive, Social and Timely. BIT has developed Digital EAST cards, which can be used to help generate BI Solutions. You can get free access to these cards by using the password 'eastcards'.
Figure 1 BIT'S EAST Framework for Encouraging Behaviour
The diagram illustrates the four components of the EAST Framework, arranged in a diamond shape: Easy, Attractive, Social, and Timely.
3.2 Applying the EAST framework to EdTech
3.2.1 Make it Easy
Most of us have been in situations where we had every intention of doing something, but never quite got round to it. The lesson that comes through most strongly from the behavioural literature is that small, seemingly irrelevant details that make a task more challenging or effortful (so called 'friction costs') can be the difference between doing something or not. Therefore, the first principle is to consider how to make it easier for users to do what you would like them to do. Some ways to 'Make it Easy' in EdTech include:
- Reducing the 'hassle factor'. Think about ways to reduce the effort required to perform an action. For example, minimising the number of clicks from logging in to starting their homework may make students more likely to begin their homework. Be cautious when adding additional steps and 'hassle' to your product – it may make users less likely to engage.
- Simplify instructions. If you are providing instructions – or any other communications – to users, it is essential that they are as simple and clear as possible. Make sure that the most important instruction is presented early, ideally in the first sentence. Be specific about recommended actions, and keep language simple.
HegartyMaths' case study: Harnessing defaults
Teachers enjoy the knowledge that MemRi will be taken care of.
Christopher Crane, Lead School Trainer for HegartyMaths
MemRi is a new feature on the HegartyMaths platform that promotes 'retrieval practice' – the process of practising content students have already learnt to avoid forgetting it. While this could be beneficial for all students, data analysis revealed that 60 per cent of classes had not had this feature turned on by their teacher (often because teachers were unaware of the feature). To try and address this, we drew on the power of defaults.
Our Solution flipped the default setting from teachers having to actively turn MemRi on for their classes (opt-in) to all classes automatically having MemRi turned on unless their teacher has turned the feature off (opt-out).
See Section 4, 'Trial', for results.
Figure 2 Defaults
| EASY |
| DEFAULTS |
| Insight |
| We tend to 'go with the flow' of a pre-set option (the 'default'). |
| How to apply |
| Make the desired behaviour the default. |
| Example |
| Automatically enrolling people into pension savings schemes, while giving them the chance to opt out, increased the number of savers. |
3.2.2 Make it Attractive
Making a particular behaviour more attractive increases the likelihood of students and teachers following through with that behaviour. There are lots of ways to make something more attractive, some of which are quite intuitive (such as personalising messages and prompts), while others are more sophisticated (such as reframing the way in which incentives are presented). Fundamentally, making an action attractive is about two main things: drawing attention to it, and making the action more appealing.
- Attract attention. Behavioural scientists use the term 'salience' to describe the way in which people are more likely to respond to things that are novel, simple and accessible. One way to attract attention would be to use students' names when addressing them on the platform. You might also want to think about making particular buttons and features on the platform brighter or animated, or providing helpful pop-ups that draw attention to key bits of information.
- Design rewards for maximum effect. It's no secret that users will be more likely to undertake a particular action if they have an incentive to do so. BI can help to structure intelligent incentives, such as:
- 'Gamifying' activities. Children are often familiar with receiving achievement badges and 'streaks' when playing video games (e.g. Rank Badges and 'Kill Streaks' on Call of Duty), and a similar approach has potential on EdTech platforms. For example, students could build up a streak for consistent engagement with the platform, and earn achievement badges for hitting certain milestones. Badges and streaks may also have a motivating effect – this could be particularly important when students are doing more independent learning than before due to school closures.
- Drawing attention to self-image. People have a powerful desire to maintain a positive self-image. Therefore, the potential gain from feeling or looking good can be a powerful incentive. For example, congratulating teachers for consistent engagement or students for hard work can boost their self-image and encourage the relevant behaviour.
- Using lotteries. People have a tendency to focus more on the size of the prize, rather than the chance of winning it. For example, you could enter all students that do a certain number of questions in a week into a lottery that has an attractive prize.
HegartyMaths' case study: Using streaks to boost student engagement
Interviews with teachers in the Explore phase suggested that a well-designed personalised streak on HegartyMaths could lead to increased student engagement and performance. Streaks have been successfully applied on other online learning products, like Duolingo.
A range of options were considered for how to implement personalised streaks. The chosen solution focused on engagement by allowing students to set a weekly goal for how many new skills they want to master, and then build a streak for the number of consecutive weeks in which they meet this goal.
Figure 3 Personalisation
This figure contains two sections related to personalisation:
The top section, 'ATTRACTIVE', has a 'PERSONALISE' sub-section.
* Insight: We are more likely to respond to information which is tailored to us.
* How to apply: Use a person's name in communications materials.
* Example: Including a person's name at the start of an SMS asking them to pay a fine increased payment rates.
Figure 4 Student selects their weekly goal; the student builds their streak each week they achieve this goal
The figure shows a simplified interface with a "Pick a weekly goal" heading and text "You'll build your streak each week you hit your goal!". Below that are three buttons: "1 New skill", "2 New skills", "3 New skills". To the right of these buttons, two trophy icons are displayed: one labeled "Current streak 5" and another "Best streak 5".
Figure 5 The student's dashboard clearly shows their current and best streak
The figure shows a dashboard for "Ayasha". It reads "Hi there Ayasha, Here is how you have been working on HegartyMaths this year! Remember to always work hard and never give up."
Below this text, there are several metrics:
* A clock icon next to "123.9 hrs" (time on site) and "0.9 hrs" (daily average time on site).
* A chart icon next to "Skills performance summary 925 skills".
* A watch icon next to "1.9 hrs" (time spent watching videos) and "0.0 hrs" (daily average video watch time).
* A cross icon next to "3928" (total questions answered) and "3261" (correct answers).
* Two trophy icons, one labeled "Current streak 5" and the other "Best streak 5".
* A button labeled "Change my goal".
See Section 4, 'Trial', for results.
3.2.3 Make it Social
We are heavily influenced by what those around us do and say. Studies show that we reduce our energy consumption when we know that others in similar households use less energy than we do. We often pay a premium for products that have been recommended by other people. And when we have told someone else that we are going to do something, we feel much more obliged to see it through. Harnessing these social influences has significant potential for EdTech.
- Make use of social norms. Descriptive norms, which make people aware of what most other people are doing, can reinforce individuals' underlying motivations. For example, telling students that 'most of their classmates have already started their online Maths homework' could encourage students that haven't started to do so. Similarly, a teacher's engagement with the platform could increase if they are told that their usage is significantly lower than other teachers in their school.
- Use the power of networks. Social networks can also be used to facilitate the adoption of a new behaviour, and to provide support to those who find it challenging. For example, it's possible that some teachers struggle to get to grips with a new EdTech product when it's introduced. A simple email prompt to the school lead to check up on their colleagues, and see if they are having issues with setting the platform up, could be the difference between a teacher engaging with the product or not.
- Encourage users to make a commitment, ideally to others. There is often a gap between what we say we want to do and what we actually end up doing. The majority of students will intend to complete their online homework on time, but not all of them will do so. Making commitments – ideally publicly – can be a powerful way to encourage people to follow through with a certain behaviour. For example, if a student sets a goal for how much learning they want to complete each week, they have made a commitment to themselves (and perhaps their teacher or parent) and they will be more likely to complete the new learning.
3.2.4 Make it Timely
Users will react differently to the same information depending on when they receive it. Our decisions and responses are often influenced by information we receive in the moment, rather than something we read or heard several months ago. Thinking about the most appropriate times to communicate with users can have a significant impact.
- Prompt users when they are most likely to be receptive. Timing really matters – the same message communicated at different times can have drastically different levels of success. The behavioural insights literature explains this by showing that people's priorities and moods are greatly affected by the context – whether they realise it or not. For example, reminders to students to complete a task may be more effective closer to the deadline when the task feels more urgent, whereas teachers may be more receptive to set up new features when they're in a planning stage.
Figure 6 Prompts
| TIMELY |
| PROMPTS |
| Insight |
| Giving people reminders at the right time can help them take action. |
| How to apply |
| Encourage individuals to take action through a well-timed message or intervention. |
| Example |
| People were more likely to give money to charity if they were asked to donate while writing their will. |
HegartyMaths' case study: Using timely prompts to encourage students to watch instructional videos
When a student gets a question wrong on the HegartyMaths platform, they receive a pop-up suggesting that they 'check their answer'. While some students will have made a simple error, others are likely to have answered incorrectly because they were unsure of the method. Our Explore research suggested that many students were attempting the quizzes without watching the video first – this was a concern given the correlation between watching the instructional videos and accuracy on quizzes.
Therefore, we proposed to show students a timely prompt immediately after they answered a question incorrectly. The prompt would encourage the student to click the 'Get Help' button that took them directly to the relevant section of the video that helped with that particular question. We believed that the timing of this prompt – immediately after the student got the question wrong – would make it more likely that the student engaged with the prompt.
We also believed that there was a possible friction cost (see Section 3.2.1, 'Make it Easy') for students that did want to watch the video, since they had to dismiss the existing pop-up and then click the 'Get Help' button. Incorporating the 'Get Help' button to the pop-up reduced friction.
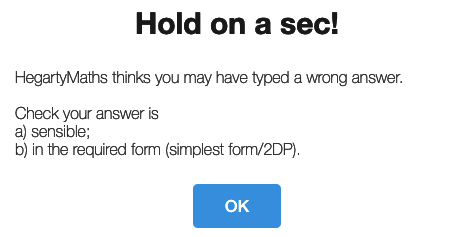 Figure 7 The existing pop-up before our intervention
 Figure 8 An example of one of the pop-ups after our intervention
Table 2 The BI-informed timely prompts that students would see if they got their first attempt at the question incorrect
| Message wording |
| Treatment 1 "Did you know? Students who watch more videos get more questions right! Get Help" |
| Treatment 2 "Did you know? An example like this is covered in the video. Click Get Help now. Get Help" |
| Treatment 3 "Have you watched the video? Even if you think you know the method, watch the video! Re-learning the skill will help you on this quiz and in the future. Get Help" |
| Treatment 4 "Did you know? Watching the videos has been the quickest way for me to improve my quiz scores. Ashley, Year 10. Get Help." |
We trialled four different behaviourally informed messages in the prompt, all of which are shown in Table 2. All of the variants included incorporating the 'Get Help' button in the prompt.
Upon logging in to the site, every student was randomly allocated to one of the five groups and then only saw this version of the prompt for the duration of the trial. As outlined in Figures 10–12 (opposite), the timely prompts:
- More than doubled the proportion of students that watched the instructional video after getting their first attempt wrong.
- Increased the accuracy of students' second attempts from 48.5 per cent to 50.6 per cent.
- Increased the accuracy of students' first attempts on other quizzes – suggesting that they learnt that watching the video was a positive thing to do, and were now doing this independently.
All of these results were statistically significant.
Figure 10 Timely prompts increased the proportion of students watching the instructional video after getting their first attempt incorrect
This bar chart shows the percentage of videos watched after help messages across five groups: Control, Treatment 1, Treatment 2, Treatment 3, and Treatment 4. The control group shows 10.2% video watch. Treatment 1 shows 21.%, Treatment 2 shows 22.3%, Treatment 3 shows 22%, and Treatment 4 shows 21.6%. All treatment groups show a statistically significant increase compared to control (p<0.01).
N = 593,983 ** p<0.01. *<0.05, + p<0.1 Primary analysis
Figure 12 The timely prompts increased students' accuracy on first attempts across the site
This bar chart shows the percentage of correct answers at first attempt across five groups: Control, Treatment 1, Treatment 2, Treatment 3, and Treatment 4. The control group shows 71.1% correct answers. Treatment 1 shows 71.9%, Treatment 2 shows 71.6%, Treatment 3 shows 71.9%, and Treatment 4 shows 71.8%. All treatment groups show a statistically significant increase compared to control (p<0.01).
N = 596,780 ** p<0.01. *<0.05, + p<0.1 Primary analysis
Figure 11 The timely prompts increased students' accuracy on their second attempts
This bar chart shows the percentage of correct answers at second attempt across five groups: Control, Treatment 1, Treatment 2, Treatment 3, and Treatment 4. The control group shows 48.5% correct answers. Treatment 1 shows 50.5%, Treatment 2 shows 50.3%, Treatment 3 shows 50.6%, and Treatment 4 shows 50.2%. All treatment groups show a statistically significant increase compared to control (p<0.01).
N = 593,983 ** p<0.01. *<0.05, + p<0.1 Primary analysis
We estimate that if all students had received a BI prompt, rather than the business as usual prompt:
- Over 2 million more videos would have been watched
- Over 7 million more second attempts would have been correct
- Almost 750,000 more first attempts would have been correct.
3.3 Narrowing your focus
Solution generation may leave you with a long list of intervention ideas. It won't be possible to do everything, so we suggest narrowing your focus by considering the potential impact of each idea, alongside its feasibility. A helpful way to do this could be to refer back to the Target behaviours you identified, and consider whether each idea is likely to lead to improvements in the areas that you identified as being most important for your platform. You may want to begin by implementing the so-called 'Quick Wins' – those ideas that are particularly feasible, while still being impactful.
HegartyMaths' case study: Shortlisting Solutions
Figure 9 An example Impact/Feasibility Matrix
This is a 2x2 matrix with "Feasibility" on the Y-axis (increasing upwards) and "Impact" on the X-axis (increasing to the right). Four numbered points are plotted: 1 (High Feasibility, Low Impact), 2 (Low Feasibility, Low Impact), 3 (Low Feasibility, High Impact), and 4 (High Feasibility, High Impact).
We came up with a long list of behaviourally informed ideas that we would have loved to test with HegartyMaths. Given the constraints on HegartyMaths' time and resources, we were not able to test them all, and had to prioritise. To do this, we made use of an Impact/Feasibility Matrix.
The relative impact and feasibility of each idea was assessed by Nesta, HegartyMaths and BIT, and then plotted on the matrix. Feasibility was considered by HegartyMaths, and mainly reflected the time it would take to develop and test the idea. Impact was considered by all three organisations, and reflected whether the idea was likely to improve the key target behaviours and the strength of the evidence behind the behavioural insight being applied (some behavioural insights draw on a more robust evidence base than others – for example, defaults are known to be highly impactful across a range of contexts).
Once we had investigated the potential strength of different ideas, we used a tool called 'All Our Ideas' which is helpful for coming to a team-level consensus about which ideas are likely to be most impactful. 'All Our Ideas' quickly uncovers the ideas that a team considers to be most likely to be successful by having all members compare one idea against another, and then aggregating each member's responses.
As an example, defaulting students to be assigned MemRi tasks was considered to be highly feasible as it only required HegartyMaths to change the default number of MemRi tasks assigned to each student from zero to one. This idea was also considered to be highly impactful as there are many examples of defaults dramatically changing behaviour. It came out as the most favoured idea from the 'All Our Ideas' process.
The HegartyMaths team focused on the Solutions that sit in the top right corner of the Impact/Feasibility Matrix – those ideas that have strong potential impact, but are still highly feasible, like changing the default for MemRi tasks.
04 Trial
4.1 Why test?
You will only introduce new features that you think are likely to be effective. However, being able to evidence impact through testing, as well as measure 'by how much' and capture any unintended consequences, will lead to much stronger development. Future decisions will be better informed, and you'll be better at articulating what your platform is doing for the teachers and students using it.
If you want to know whether your Solution has an effect on your Target behaviour and how large this effect is, you need an impact evaluation. The goal is to find out by how much (if at all) outcomes in the group that received your intervention changed because of your intervention.
There are a range of ways to do this, but the most robust method is to use a randomised control trial (RCT) – the gold standard of evaluation. Some people believe that conducting impact evaluations – and particularly RCTs – needs to be costly, complicated and time consuming. However, we know from experience at HegartyMaths that it is possible for EdTech companies to build the infrastructure for rapid testing cheaply and easily. Rapidly testing new ideas, iterating to improve, testing again and then rolling out to all users is an approach that is achievable for all EdTech companies.
This diagram illustrates the concept of a randomized assignment for intervention and control groups. It shows a group of users being randomly assigned into two separate groups: an "Intervention" group and a "Control" group.
4.2 Building the infrastructure for rapid testing
It is refreshing to work with a company that builds products based upon research and monitors success.
Teacher, HegartyMaths partner school
The basic idea is that we randomly divide students into two groups so that we can be sure that these groups will be very similar on average. We then give one group the intervention, or new/different feature (the treatment group) and the other group receives the 'business-as-usual' version (the control group). If we find that the group that received the intervention has different outcomes afterwards, we can be confident that this difference was caused by the intervention – provided the sample size (the number of students in each group) is large enough, as is the case for many EdTech platforms.
This approach can also be used to identify the impact of interventions on specific sub-groups, if you hold this data. For example, if you have enough students, you can analyse the data to explore the impact of the intervention on students eligible for Free School Meals (FSM). This may uncover that certain interventions are particularly effective, or not effective, for certain groups. Following this strategy could help you develop a product that is tailored to the needs of students.
It is also worth noting that while nobody introduces a feature they expect to be ineffective, or to worsen outcomes for students, not every new idea will be effective. This is one of the strongest arguments for evaluating ideas using an RCT. The Education Endowment Foundation (EEF) recently evaluated Achievement for All in an RCT and found that it resulted in negative impacts on academic outcomes for pupils. Children in the treatment schools made two months' less progress in Key Stage 2 Reading and Maths, compared to children in control schools, in which usual practice continued. Our own results (see case study on page 29) show that, in the short term at least, introducing streaks has led to lower engagement.
For this project, HegartyMaths invested in an A/B testing software called LaunchDarkly. This gave them the ability to develop multiple versions of the online platform and randomly assign students to each environment. Data could then be collected afterwards to compare outcomes for students that engaged with the different environments.
HegartyMaths' case study: Testing timely prompts
In section 3.2.4, we outlined a Solution that we developed to encourage more students to watch instructional videos after getting a question wrong on a quiz. We tested the 'business-as-usual' prompt against four different BI-informed prompts, which all integrated a direct link to the video into the pop-up.
Upon logging in to the site, every student was randomly allocated to one of the five groups and then only saw this version of the prompt for the duration of the trial. As outlined in Figures 10–12 (opposite), the timely prompts:
- More than doubled the proportion of students that watched the instructional video after getting their first attempt wrong.
- Increased the accuracy of students' second attempts from 48.5 per cent to 50.6 per cent.
- Increased the accuracy of students' first attempts on other quizzes – suggesting that they learnt that watching the video was a positive thing to do, and were now doing this independently.
All of these results were statistically significant.
Figure 10 Timely prompts increased the proportion of students watching the instructional video after getting their first attempt incorrect
This bar chart shows the percentage of videos watched after help messages across five groups: Control, Treatment 1, Treatment 2, Treatment 3, and Treatment 4. The control group shows 10.2% video watch. Treatment 1 shows 21.%, Treatment 2 shows 22.3%, Treatment 3 shows 22%, and Treatment 4 shows 21.6%. All treatment groups show a statistically significant increase compared to control (p<0.01).
N = 593,983 ** p<0.01. *<0.05, + p<0.1 Primary analysis
Figure 12 The timely prompts increased students' accuracy on first attempts across the site
This bar chart shows the percentage of correct answers at first attempt across five groups: Control, Treatment 1, Treatment 2, Treatment 3, and Treatment 4. The control group shows 71.1% correct answers. Treatment 1 shows 71.9%, Treatment 2 shows 71.6%, Treatment 3 shows 71.9%, and Treatment 4 shows 71.8%. All treatment groups show a statistically significant increase compared to control (p<0.01).
N = 596,780 ** p<0.01. *<0.05, + p<0.1 Primary analysis
Figure 11 The timely prompts increased students' accuracy on their second attempts
This bar chart shows the percentage of correct answers at second attempt across five groups: Control, Treatment 1, Treatment 2, Treatment 3, and Treatment 4. The control group shows 48.5% correct answers. Treatment 1 shows 50.5%, Treatment 2 shows 50.3%, Treatment 3 shows 50.6%, and Treatment 4 shows 50.2%. All treatment groups show a statistically significant increase compared to control (p<0.01).
N = 593,983 ** p<0.01. *<0.05, + p<0.1 Primary analysis
We estimate that if all students had received a BI prompt, rather than the business as usual prompt:
- Over 2 million more videos would have been watched
- Over 7 million more second attempts would have been correct
- Almost 750,000 more first attempts would have been correct.
HegartyMaths' case study: Testing a change in defaults
We've realised it would actually be crazy to not test things.
Brian Arnold, Co-Founder, HegartyMaths
As outlined in section 3.2.1, MemRi is an innovative feature of the HegartyMaths product, but one that was being underused by teachers. We tested the effect of 'flipping the default', in which all classes were defaulted into receiving the MemRi feature (but teachers had the option to turn it off). Under the previous scenario, teachers had to actively configure the feature for their classes.
We tested this Solution using a pre-post evaluation strategy, in which we compared outcomes before and after the default was flipped.
Figures 13–14 outline the impact of the switch in default. In short, the change in default increased the number of students with a MemRi goal by 42 per cent and increased the number of unique students completing MemRi quizzes. These numbers drop significantly in week 29, but we think that this reflects an 'end of term' effect. It will be interesting to see how these numbers change in the new academic year.
Figure 13 The number of students with a MemRi goal
This bar chart shows the number of students (in thousands) with a MemRi goal across several weeks from 2020/24 to 2020/29. Before intervention launch (dotted line between 2020/26 and 2020/27), the number was around 500,000. After the launch, the number rises to around 750,000 in week 2020/27 and stays consistent around 800,000 for 2020/28 and 2020/29.
Year/week
Dotted line represents intervention launch
Figure 14 The number of unique students completing MemRi quizzes
This bar chart shows the number of unique students (in thousands) completing MemRi quizzes across several weeks from 2020/24 to 2020/29. Before intervention launch (dotted line between 2020/26 and 2020/27), the number was around 500,000. After the launch, the number rises to around 800,000 in week 2020/27 and then drops slightly in weeks 2020/28 and 2020/29.
Year/week
Dotted line represents intervention launch
HegartyMaths' case study: Using streaks to boost student engagement
As outlined in section 3.2.2, we developed a Solution that sought to encourage consistent and regular use of the HegartyMaths platform over time. The Solution involved students setting a weekly skills goal, and then building up a streak for every week in which they met their goal.
Research suggests that the effectiveness of such a feature builds up over time. However, due to time constraints, we were only able to run the trial for 10 days in the run up to the end of the school year. This meant that students were only able to build a streak of 1, and we think this may partly explain the results we observed here. As outlined in Figures 15–16, the feature appears to have actually led to lower levels of engagement in the trial period – demonstrating the importance of testing features that you think may be impactful, as well as the importance of testing over time.
We have recommended that HegartyMaths test the feature over a longer time period to see whether this result changes as students have time to build up a larger streak. While this may happen, it could also be the case that a streaks feature is simply not effective on the HegartyMaths platform. Without an A/B approach to testing, HegartyMaths would not have been alerted to the potential negative impacts of this new feature.
Figure 15 The effect of the streaks feature on time on site
This bar chart shows the average time on site per week (in minutes) for a control group and a treatment group. The control group spent 56 minutes on site per week, while the treatment group spent 51 minutes. This shows a decrease in time on site for the treatment group.
N = 483,326 ** p<0.01. *p<0.05, + p<0.1
Primary analysis
Figure 16 The effect of streaks on number of questions answered correctly
This bar chart shows the number of new questions answered correctly for a control group and a treatment group. The control group answered 13.2 questions correctly, while the treatment group answered 12.2 questions correctly. This indicates a decrease in correctly answered questions for the treatment group.
N = 486,661 ** p<0.01. *p<0.05, + p<0.1
Secondary analysis
05 Next steps
This framework outlines a process for applying behavioural insights to remote learning platforms. Each step in the framework offers a different benefit and tool for improving outcomes:
- Identify Targets for improvement – focus on the behaviours of your students and teachers that are most likely to improve outcomes, and shortlist them according to importance.
- Conduct Exploratory research – explore your platform with a behavioural lens, focusing on the views, experiences, emotions and motivations of students and teachers using your platform.
- Draw on behavioural insights, and tools like the Digital EAST cards, to generate practical Solutions, and then prioritise these for feasibility and potential impact.
- Test the Solutions you develop, using randomised controlled Trials if you can, to ensure your results are as robust as possible.
If you have any questions or comments, please get in touch with one of the team. Join the conversation on Twitter, using the hashtag #BIEdTech.
If you start implementing a behavioural insights approach on your platform, we'd love to hear about it!
Hannah Owen
[email protected]
Nesta
www.nesta.org.uk
Lal Chadeesingh
[email protected]
Behavioural Insights Team
www.bi.team
Brian Arnold
[email protected]
HegartyMaths
hegartymaths.com


