Executive Summary
Barcelona en Comú (BeC) is an emerging grassroots movement-party that won the 2015 Barcelona City Council election. The candidacy was devised by activists involved in the 15M movement (Monterde, Toret, Serrano, & Calleja-López, 2015) in order to turn citizen outrage into institutional and deeper social change. Building Barcelona en Comú was a laborious process of around a year. Started in June 2014, it involved grassroots organizations, some political parties (among them Initiative for Catalonia-Greens, Equo, and Podemos) as well as individual activists and citizens.
In the first part of this report we detail some of the technopolitical processes involved in developing BeC as a citizen-led electoral coalition: the drafting and validation of an ethical code, the validation of the electoral candidacy, the elaboration of the electoral program, and more. In order to detail the role of the D-CENT tools in this construction effort, we have subdivided the first part of this report into two halves, one for each technical platform used: the first devoted to Democracy OS, and the second to Participa. As we show, both played key roles in the online-offline process of building BeC. When the electoral campaign started in May 2015, social networks became central for the communication and organisation of BeC.
In the second part of this report we analyse the innovative structures of those social networks, which both inherit structures and practices from the 15M movement while departing from them on many respects. On the one hand, the 15M movement is based on a decentralized structure. On the other hand, political science literature postulates that parties historically develop oligarchical leadership structures. This tension motivated us to examine whether BeC preserved a decentralized structure or adopted a conventional centralized organization. We analyse the Twitter networks of the parties that ran for this election by measuring their hierarchical structure, information efficiency and social resilience. Our results show that in BeC two well-defined groups co-exist: a cluster dominated by the leader and the collective accounts, and another cluster formed by the movement activists. While the former group is highly centralized like the other major parties, the latter one stands out for its decentralized, cohesive and resilient structure.
Part I. Analysis of participation processes
Barcelona en Comú is a citizen platform launched on June 2014 with the goal to win the local elections of Barcelona, due on May 2015. Initially under the name of "Guanyem Barcelona” (Let's win Barcelona) and then "Barcelona en Comú” (Barcelona in common) the platform's first step was to launch an open call to grassroots organizations and the citizenry of Barcelona to get actively involved in the emerging citizen-led platform.
Taking inspiration and practices from the 15M (or indignados) movement, BeC's promoters aimed to build an inclusive, transversal, popular and participatory process to construct a strong candidacy. Even if previously existing parties were involved (Podemos, Initiative for Catalonia-Greens, and Equo) and that implied a dose of party negotiation and weight, the participatory processes open to the citizenry were key. Following 15M technopolitics (Toret et al., 2015), information technologies, as well as offline-online hybrid dynamics, were seen as a crucial element in the articulation of citizen participation. In the next section we provide a general description of BeC's participation processes.
1.1 General description of the participation processes in Barcelona en Comú
BeC developed various participation processes to build key parts of its structure and its political campaign: its ethical code, the electoral program, or the candidates for the elections. The collaborative process to elaborate the electoral program for the local elections is a landmark of the "new politics" gaining strength in Spain after 15M, giving rise to a real democratic revolution. Participants from different parties, as well as activists, social movements and citizens in general, were distributed and organized in different provisional structures that we detail below.
1.1.1 Barcelona en Comú organizational model
BeC's organization (before and right after the elections) has been structured in different technical and coordination commissions, territorial groups, thematic areas, a plenary and a general digital participation platform open to the whole of the citizenry (Participa). The organizational model, presented in Figure 1, consists of the following groups:
- Barcelona en Comú Neighborhood groups. They are neighborhood or district organizational spaces where everybody can participate and assist to the meetings proposed. These groups are organized as open and self-managed assemblies, but their functions and decision-making ability are bounded: they must meet the reality and the social fabric of the territory in which they are framed. There is a group of neighborhood coordinators. They facilitate, support and coordinate BeC's Neighborhood Groups. They are supposed to be proactive and brainstorming spaces for the development of diagnosis and program proposals focused on the problems of the neighborhoods. They are the link between the districts and the Plenary, through which diagnosis, proposals and consultations circulate. During the campaign around 1,000 people were actively involved in neighborhood groups.
- Technical Commissions. They are workspaces where the specific tasks essential to the daily functioning of BeC are made. Each committee defines the number of their members, their profile and internal organization (subcommittees, roles, working groups...). Around 250 people were involved in these commissions during the electoral campaign.
- Thematic Areas or Axes. They are meeting and participation spaces for entities and individuals linked to different thematic areas. In that sense, they are not BeC exclusive spaces, but their main role is to propose and validate the contents of BeC, the different issues that are important for Barcelona and to identify proposals for the future. There currently are the following areas: health, education, employment, precariousness, inequality and poverty, the city's economy and environment, housing and urban development, migration, gender and sexual diversity, information society, culture, local governance, transparency and participation, security and civil rights.
- General Coordination Group. It is the executive board. It oversees the development of the party (strategy, roadmap, overall schedule, analysis of current situation, etc.) and coordinates the different aspects of the organizational structure. It consists of three spokesperson and their support team, two people from each of the technical commissions, and other people who are part of the working groups (Technical Commissions or Thematic Areas) and, occasionally, by people who are invited by the Coordination Group itself.
- The Plenary is the space of aggregation for making the important decisions of Barcelona en Comú, especially with regard to strategic decisions and internal organization. It is open to all members of the Technical Commissions, the Thematic Areas, the Neighborhood Coordination Spaces, the General Coordination Group, the first signatories of the manifesto, and those who have been explicitly proposed by the whole General Coordination Group.
- Participa is the digital platform to vote some of the most important decisions of BeC, which are consulted as the validation of the candidates, the ethical code, or the election of district councilors. Participa works at the same time as a general census of the BeC organization.
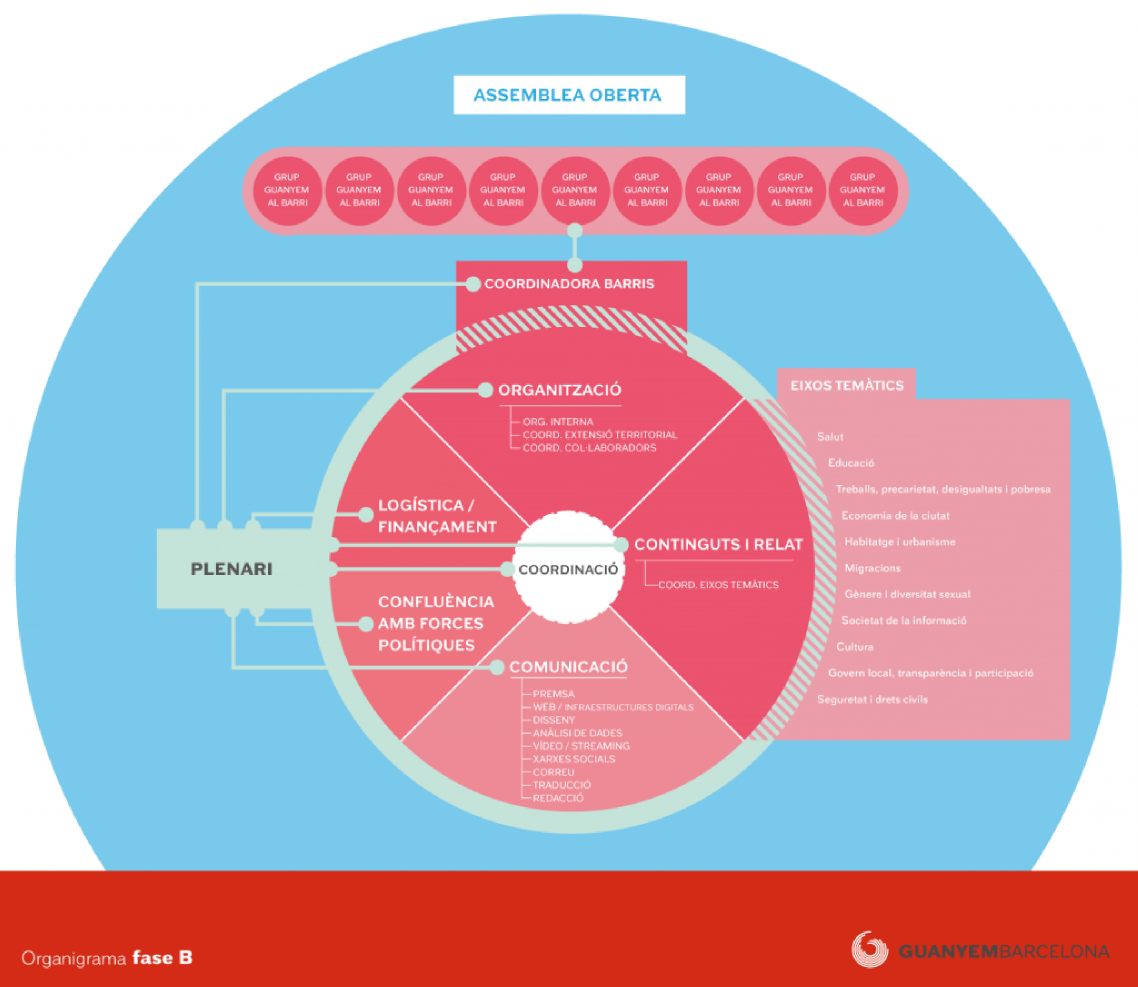
Figure 1: Barcelona en Comú organizational model.
1.2 Case study 1: DemocracyOS
Our first case study is based on the collaborative amendments digital platform DemocracyOS, which allows different ways to participate. Starting from a determined text the tool allows to comment, vote comments, reply to the entire document or below a specific part of the text. This platform was improved and customized by D-CENT and used in the first stage of the elaboration of BeC municipal program and was split in two phases. This phase consisted of the contributions to the document of urgent measures (previously drafted by the thematic areas of the organization) through DemocracyOS, where proposals were divided into 4 blocks. People were able to develop new proposals and improve the ones included in the initial document. The second phase consisted in the Prioritization of the proposals. After that the proposals arising from the first phase were included in the Participa platform so that they could be prioritized by the citizens through voting. The online development of the local electoral program aimed at evaluating and debating a document or a given proposal. With this online platform, users can amend the original text and also give new proposals that can be voted and receive comments from the rest of the community. Figure 2 shows a screenshot of the DemocracyOS platform for Barcelona en Comú.
The platform was divided in two areas: The first one (amendments area) allows users to make annotations to the document previously developed in order to include specific improvements, by clicking on the right side of each of the paragraphs. In the second area, or new proposals area, placed at the bottom of the document, participants could make new proposals to be included in the program.
Figure 2: Screenshot of the Democracy OS platform showing a section titled "4. Per una Barcelona que torni el poder i la capacitat de decisió a la seva gent" with an illustration of a building. It also shows options for participation and reading full text, along with social media sharing icons (f, 8+). Text on the page also includes: "Atenció! Abans de participar, llegiu manual i les normes d'ús.", "OBRIM LES INSTITUCIONS", "Tancat fa 7 mesos", "4.Por una Barcelona que vuelva el poder y la capacidad de decisión a su gente", and the blockquote text.
Totes aquestes mesures reclamen un canvi radical en la forma de prendre les decisions, de concebre les institucions i de gestionar la ciutat. Una ciutat intel·ligent és una ciutat que dona veu a la intel·ligència col·lectiva del seus habitants en la presa de decisions. Per això, necessitem transformar l'Ajuntament, posar fi a les males pràctiques, aplicar més el sentit comú i generar institucions menys burocratitzades i més eficaces per resoldre els problemes concrets de les persones que viuen a Barcelona.
Hem de dotar d'un nou sentit i força a conceptes fets servir de manera massa utilitària o funcional com participació, transparència, autogestió i control ciutadà, i comprometre'ns, entre altres mesures, a:
1.2.1 Electoral program
1.2.1.1 Description
For the elaboration of the municipal program, the organization worked for 6 months in 13 thematic groups through physical meetings and working sessions open to public participation. The documents (45 proposals) that resulted from these working groups were then submitted to a digital participation process open to all citizens, on the Democracy OS platform. The aim of the process (open for 12 days) was to amend the priority actions in order to generate 16 new proposals from the citizenship. With the 16 most voted city proposals, 60 final proposals were conformed, which were then submitted. Out of the 60, 40 measures were then prioritized through voting via Participa, and divided into 4 blocks, which constitute the core of BeC's program. The process is showed in Figure 3. As a result, a technopolitically articulated "citizen mandate" was obtained.
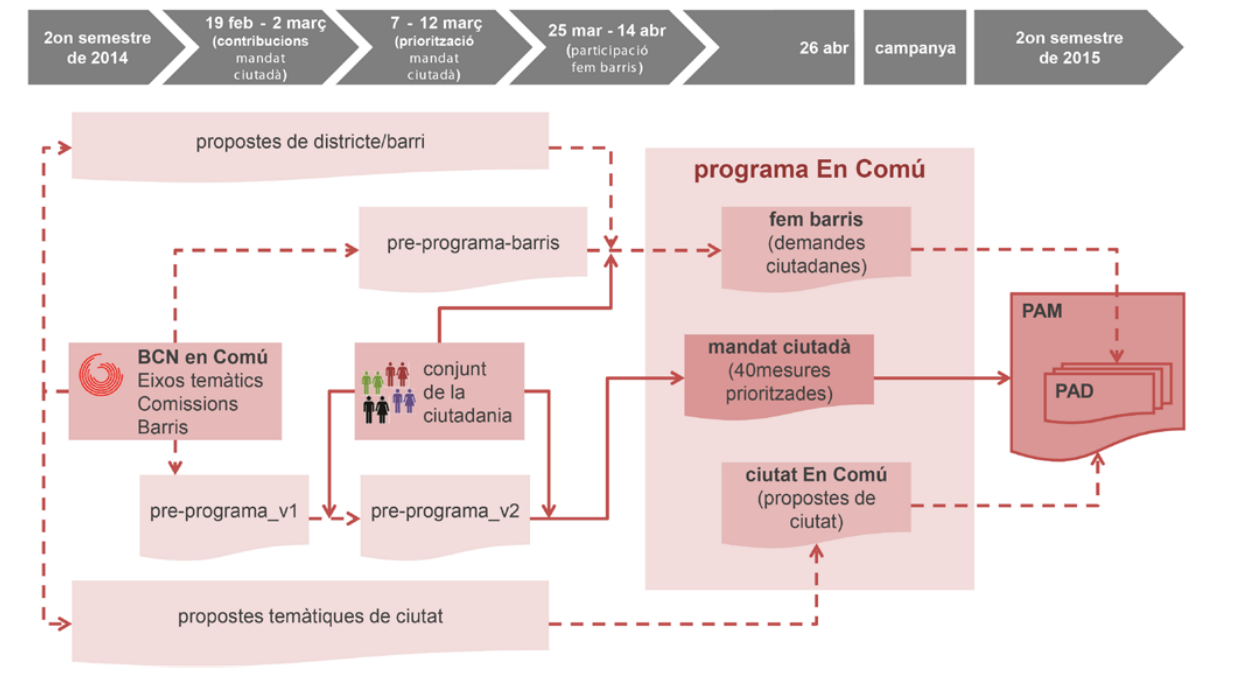
Figure 3: The process scheme of the Electoral Program.
The proposals were divided into four thematic blocks:
1. "Social emergency: For a Barcelona that addresses the social emergency and ensures a vital minimum to everyone's living",
2. "Structural changes: For a fairer Barcelona, that generates decent employment and defends what is public and common",
3. "A more human Barcelona: For a more human Barcelona, that takes care of its people and the environment",
4. "Let's open the institutions: A Barcelona that returns people's power and capacity to decide".
1.2.1.2 Participation indexes
1,599 people registered for the process of drafting the electoral program via Democracy OS. They contributed 804 comments, 239 responses and 1,091 supports for the 45 proposals that had resulted from the previous offline process. In the end, 60 policy measures resulted, out of which 40 were to be prioritized later in an election via Participa (see section 1.4 below).
1.2.2 Ethical code
1.2.2.1 Description
The ethical code is a set of rules defined by the organization of BeC and submitted to an open participatory process about the conditions that the candidates for the elections had to accomplish. For example the ethical code establishes the maximum salary of each representative in the city council, or the transparency in the public agenda of the councilors. The process around an ethical code (understood as a contract with the citizenship as transparency conditions) started with a document drafted collaboratively with the different political forces that form the confluence and was later presented and discussed in a workshop-conference. During the conference, a participatory process was launched through the DemocracyOS platform, generating a debate between what was being said in the meeting and the process being held on the network. The summary of these contributions was finally validated by 1,049 people.
1.2.3 Participation indicators
350 people participated in the physical workshop-conference and 365 users did it online. During the participation process the users generated 321 comments and 957 votes were emitted to vote positively or negatively on the comments. 139 answers were submitted to the comments. Finally the validation process of the ethical code was voted affirmatively by 1,049 users, the 96.68% of the total number of voters.
1.2.4 Demands for each district
1.2.4.1 Description
In parallel to the elaboration of the electoral program for the local elections, there was a process to collect demands, diagnosis and proposals for each of the districts and neighborhoods. This process, also held through DemocracyOS, consisted in different online spaces divided by neighborhood, where people raised and elaborated proposal to be included in the future municipal action program and district action program, if the party finally gets electoral representation.
1.2.4.2 Participation indicators
During the online participatory process to elaborate the demands, 1,689 proposals were collected, made by 247 active users. Considering the comments and the answers, 1,565 contributions were made, achieving a rich list of proposals for the neighborhoods, to be incorporated into the electoral program of BeC, and discussion around them.
1.3 Case study II: Participa
Between March 7th and 12th, a total of 4,583 people participated in the primaries opened by Barcelona En Comú (BeC). The process allowed people to choose, in a triple election, the head of the list, the first list of district councilors (a second, more complete set was to be chosen after the elections, depending on results), and the top priorities of BeC's political program for the local elections due on May 24th. 3,188 people participated in the three of these elections. We detail the participation indicators below.
After being the most voted list in the local elections, Barcelona en Comú had to configure a government at different levels. In order to fulfill this duty, full teams of District Councilors (rather than only single figures, like in the first District Councilor election) had to be configured for each of the 8 districts where BeC was the most voted list (Barcelona is divided into ten districts). The voting of different candidacies was carried on in Participa between July 16th and 18th powered by the secure voting system Agora Voting (see Figure 4). The results of the election are described below.
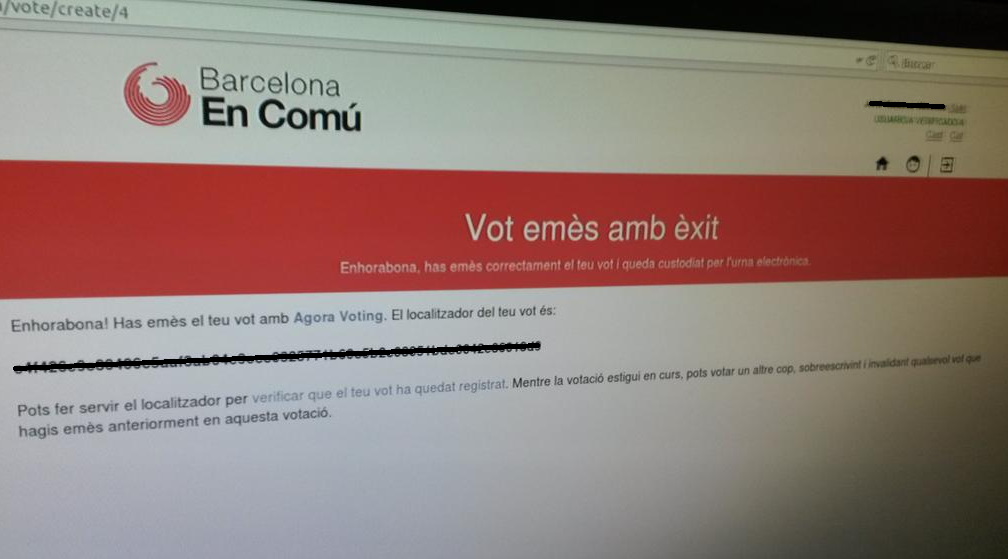
Figure 4: Screenshot of the verification message by the secure voting system Agora Voting.
1.3.1 Prioritization of policy measures
1.3.1.1 Description
As we commented above, the process of technopolitically articulating the "citizen mandate" in the form of a political program for the 2015 local elections had three basic steps: public, offline working on proposals, online review and discussion (with the aid of Democracy OS), and online prioritization. For this third step the Participa platform was deployed. People had to vote their preferred proposals out of the 60 resulting from previous off-online processes (see Figure 5). The participation indicators are listed below.
1.3.1.2 Participation indicators
3,544 people (80%) out of 4,430 registered users with a right to vote (of a total of 5121 registered users) participated in the process of prioritization, carried on in Participa. The age distribution among participants in the election is shown in the chart below (see Figure 6).
1.3.2 Validation of electoral candidacy
1.3.2.1 Description
As part of the citizen, participatory process of constructing BeC, an election was set up in order to validate the list that would run for the municipality of Barcelona. The list led by Ada Colau (ex-spokeswoman for the PAH, co-founder of BeC and current Mayor of Barcelona after the City Council elections) was the only one presented for the validation.
1.3.2.2 Participation indicators
For the process of validating BeC's electoral list, there were 3,858 (87%) participants out of a total of 4,430 of registered users with a right to vote. 3,387 votes (87.8% of the total of votes casted) supported Ada Colau and her team. The age distribution among participants in the election is shown in the chart below (see Figure 7).
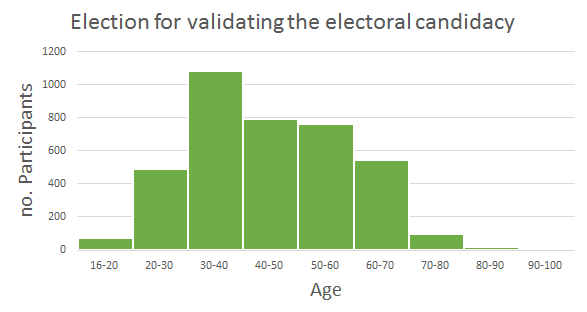
Figure 7: Age distribution of the participants in the election for validating the electoral candidacy.
1.3.3 District councilors election I
1.3.3.1 Description
Barcelona's 73 neighborhoods are grouped into 10 districts. In the third election of the March primaries, Participa's verified users were allowed to choose among different people for seats as District Councilors, one per district. The participation indicators are listed below.
1.3.3.2 Participation indicators
For the election of district councilors, 4,401 people voted in Participa, out of 4,430 with a right to vote. This amounts to the highest percentage of participation in all of the three primaries elections (99%). The age distribution in the voting is presented below (see Figure 8).
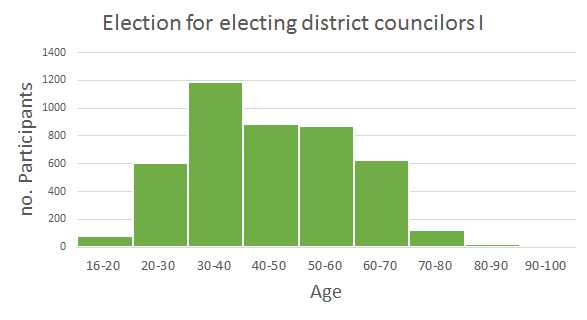
Figure 8: Age distribution of the participants in the election for electing district councilors I.
Several factors probably coincided for making the level of participation particularly high: the novelty of the processes (this was the first time that a municipal candidacy promised to let the neighbors of each district choose their district representatives), their relevance, the personalized character of the choice, and the competitive character of the election.
1.3.4 District councilor election II
1.3.4.1 Description
After being the most voted list in the local elections, Barcelona en Comú had to configure a government at different levels. Among others, they had to select full teams (rather than only single figures) of District Councilors for the 8 districts where it was the most voted list (Barcelona is divided into ten districts). The process, carried on in the first half of July, was opened to all the citizenry for presenting candidacies in their neighborhoods. After a first step of configuration of candidacies, BeC registered (and verified) members were able to vote and choose among candidacies via Participa. As we mentioned above, this election took place between July 16th and 18th.
1.3.4.2 Participation indicators
Out of a total of 9,226 users with a right to vote, 2151 participated in the election (23.3%) — the total of registered users in Participa amounting to 13,134. This represents an extremely sharp decline in relation to previous elections. It was probably due, among other factors, to the dates of the election (mid-July) and, more importantly, the fact that it did not coincide with a process of primaries like it happened in the case of the March elections: in March people could vote several things in a single sign up and, no less importantly, the elections took place in the context of an ongoing process of activist mobilization and construction of a new party. That said, it remains surprising (and there probably are further cases for the fact) that the first and the second voting for district councilors stay as the most and the least participated elections organized in Participa.
We also see an interesting variation in the age distribution among participants, with an especially sharp reduction of participants in the 30-40 age group. The age distribution in the election is presented below (see Figure 9).
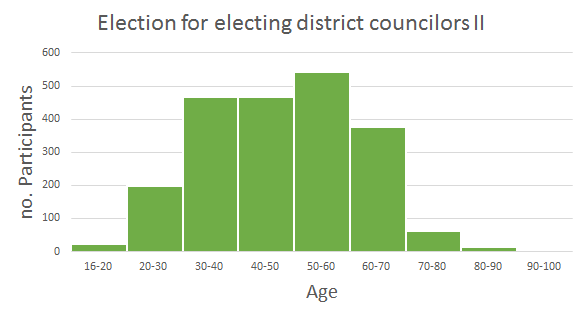
Figure 9: Age distribution of the participants in the election for electing district councilors II.
To conclude, we present the age distribution among people registered in Participa as of September 19th, 2015 (see Figure 10)
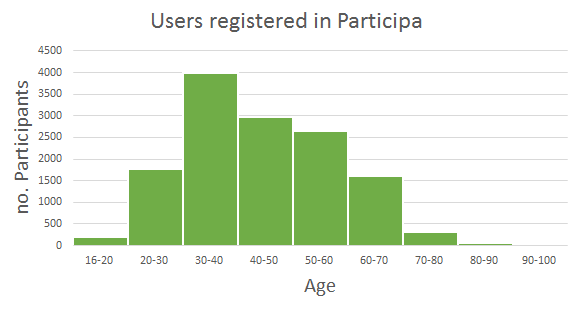
Figure 10: Age distribution of users registered in Participa (19-09-2015).
1.4 Discussion
With respect to the uses of the DemocracyOS platform, the process was oriented to open-up and increase participation, and to generate new proposals from interested and engaged citizens. The process exhibited remarkable levels of participation according to the number of proposals, amendments and comments. In sum, almost 1,600 people participated in some process via DemocracyOS. The manual analysis of the deliberation process performed by (Borge & Santamarina, 2015) shows that online debate effectively improved the quality of the proposals. The analysis also reveals that the reciprocity of comments between pairs of users was low, since there were not many conversations between participants oriented to discuss the different proposals from different viewpoints. One reason behind this finding could be that the bulk of the debate was held in precedent physical meetings and workshops, in line with the hybrid online-offline approach designed by BeC. The openness of the whole process (ethical code, electoral program and neighborhood proposals) shows one of the main characteristics of the emergent electoral initiatives: the collaborative dimension of political commitment to new forms that promote the role of the citizenship in electoral processes.
Regarding the use of Participa, the charts show a clear prominence of people between 30 and 40 years old among BeC voters in the primaries. This group was followed by another two with similar participation rates among themselves, namely, the groups of those between 40 and 50 years old and between 50 and 60. This is a pattern that repeats itself in all the three March elections and suggests the primacy of middle-aged people in BeC's constituency, with particular strength of 30-something people. This result is confirmed by the age distribution shown in Figure 10 of the age groups in September 2015. As of September 16th, almost 4,000 of the 13,559 registered users (29.5%) belonged to this age range – with the number of the second biggest age group, those between 40 and 50 years old, not reaching the 3000. In previous studies (Monterde, Toret, Serrano, & Calleja-López, 2015), we have shown this age group to be the most active in and affected by the 15M movement. Several key figures in BeC such as Ada Colau, who was ex-spokeswoman for the PAH (Platform of Mortgage Victims), played relevant roles in the movement and have afterwards helped to convey its demands through BeC. Just as an example, a proposal to stop foreclosures for economic reasons – perhaps the key demand of the PAH – was the most voted one among BeC's 40 top priority measures.
1.5 Conclusions
BeC's multiple participation processes may rank differently when it comes to levels of deliberation, or even participation.
In the electoral program and ethical code elaboration via DemocracyOS, participation was lower than in the Participa elections. Probably, this is because it implied a higher level of commitment in terms of time and effort. To amend the original text required reading, correcting, or elaborating new proposals, which implies more than just submitting a vote. An extra limitation may have been the independent login via the Participa platform, which may have confused participants. Finally, improvements may be required in the organization of threads, including the possibility to organize comments by most voted, most responded, and most recent.
In the primaries carried on in Participa, we saw high levels of participation. This suggests that factors such as ongoing involvement and mobilization, novelty, multi-election (the possibility of voting several things within the same process), or dates (March for the Primaries vs. July, for the fourth election) can strongly affect participation results. Interestingly, the numbers suggest — although surely are not enough to prove — that the so called "digital divide" does not crucially affect the levels of participation in BeC until the 70-something age group. The participation numbers (as well as the number of registered people as of September 2015) in Participa is rather similar for those in their 60s (traditionally considered not tech-savvy group) and those in the 20-30 age group (a presumably tech-savvy one). Factors such as diversity in level of interest in politics (usually lower among youngsters) and BeC's technopolitical on-offline participation processes may be among the factors accounting for these initial results.
Beyond the effect of the demographic distribution of citizens, strong political affiliations to traditional politics and, therefore, lower experience in citizen participation among older people may partly account for the decline in participants (and registered people in Participa) over 70 perhaps as much as the potential differences in digital literacy or access. Nevertheless, the most remarkable finding is that the fraction of people from 40 to 60 is comparable to the ones from 20 to 40. This outcome could be explained by the promotion of participation through offline channels in order to break the digital divide (see Figure 11). It will be interesting to examine whether this pattern will hold over time and at different scales of participation.
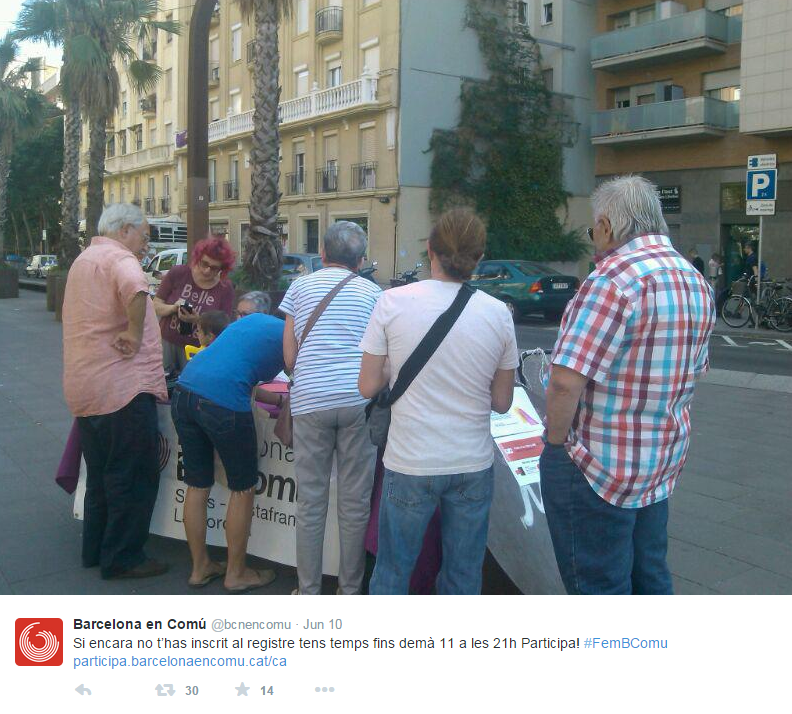
Figure 11: Tweet for promoting participation through offline channels.
In the last years a new global wave of citizen protests has emerged: the Arab Spring, the 15M movement in Spain, Occupy Wall Street, #YoSoy132 in Mexico, Occupy Gezi in Turkey, the Brazilian movement #VemPraRua, Occupy Central in Hong Kong, etc. All these movements share common characteristics such as the claim for new models of democracy, the strategic usage of social media (e.g. Twitter), and the occupation of physical spaces.
All of them have encountered difficulties in modifying the institutional agenda and, hence, the public policies. The 2015 Barcelona City Council election is one of the first cases in which one of these movements has got to "occupy" the public institutions by building Barcelona en Comú (BeC), a political party that won the elections. BeC was conceived as the confluence of (1) minor and/or emerging parties and, to a large extent, (2) collectives and activists, with no political party affiliation, who played a prominent role in the 15M movement.
The 15M movement, also referred to as #SpanishRevolution or the "Indignados" Movement, emerged in May 2011 and has been defined as a "networked social movement of the digital age" (Castells, 2013). Networked social movements, like the Arab Spring, the 15M and Occupy Wall Street, are claimed to be "a network of networks, they can afford not to have an identifiable centre, and yet ensure coordination functions, as well as deliberation, by interaction between multiple nodes” (Castells, 2013). Other authors have formulated similar hypotheses when defining this new model of social movement as a "change from logic of collective action, associated with high levels of organizational resources and the formation of collective identities, to a logic of connective action, based on personalized content sharing across media networks" (Bennett & Segerberg, 2012). We should note that some voices have refused these theoretical assumptions and argued that "a handful of people control most of the communication flow" and, consequently, the existence of leaders in such movements could not be denied (Gerbaudo, 2012). Empirical studies revealed that the 15M network on Twitter is characterised by its "decentralized structure, based on coalitions of smaller organizations" in spite of "a small core of central users is still critical to trigger chains of messages of high orders of magnitude” (González-Bailón, Borge-Holthoefer, Rivero, & Moreno, 2011). Decentralization has been also observed in (Toret, et al., 2015) in which the 15M network is defined as open and polycentric.
The 15M network properties (i.e. decentralization, openness, polycentrism) could be perceived as a striking contrast to conventional political organizations, in particular, political parties. The Iron Law of Oligarchy (Michels, 1915) postulates that political parties, like any complex organization, self-generate an elite (i.e. "Who says organization, says oligarchy"). Although some scholars have criticised the idea that organizations will intrinsically build oligarchical leadership structures (Lipset, Trow, Coleman, & Kerr, 1956), many political and social theorists have supported that, historically, small minorities hold the most power in political processes (Pareto, 1935) (Mosca, Livingston, & Kahn, 1939) (Mills, 1999). Regarding Spanish politics, a study of the 2011 national election campaign on Twitter revealed "minor and new parties tend to be more clustered and better connected, which implies a more cohesive community" (Aragón, Kappler, Kaltenbrunner, Laniado, & Volkovich, 2013). Nevertheless, all the diffusion networks of parties in that study were strongly centralized around their candidate and/or party profiles. Later studies analysed the interactions on Twitter between the 15M nodes and political parties and conclude that networked social movements are para-institutions: perceived as institutions but preserving an internal networked organization (Peña-López, Congosto, & Aragón, 2014). However, these conclusions were formulated by analysing the networks when no elections were held, before institutionalisation began. Election campaigns are competitive processes that might favour the centralization of an organization around candidates. Indeed, it has been proved that the network properties of political parties change when elections arrive (Garcia, Abisheva, Schweighofer, Serdult, & Schweitzer, 2015).
Given that Barcelona en Comú emerged from the 15M and this networked movement is characterised by a decentralized structure, the research question of this study is the following:
Has Barcelona en Comú preserved a decentralized structure or has it adopted into a conventional centralized organization ruled by an elite?
Previous hypotheses (Toret, 2015) about Podemos, a member party of the Barcelona en Comú candidacy and also inspired by the 15M movement, postulate an organization formed by a front-end ("spokesmen/spokeswomen who are visible from the media perspective”) and a back-end (“muscle of the organization, barely visible from the media perspective"). Per contra, there are no empirical validations of this hypothesis. We strongly believe that the answer to the above research question will provide relevant insights into the institutionalisation of this new paradigm of social movement.
Motivated by our research question, we aim to characterise the social structures of Barcelona en Comú by comparing its diffusion network on Twitter to the ones of the other political parties running for this election. The identification of the sub-network corresponding to each party is made possible by the highly divided partisan structure of the information diffusion network. This assumption relies on previous studies of political discussions in social media (Adamic & Glance, 2005) (Conover, et al., 2011). Recent research in data-driven political science has revealed the recurrent existence of boundaries between ideological online communities, in particular, political parties. A study of the 2004 U.S. Presidential election depicted a divided blogosphere in which liberals and conservatives barely generated links between the two communities (Adamic & Glance, 2005). Similarly, the network of retweets for the 2010 U.S. congressional midterm elections exhibited a highly segregated partisan structure where connections between left- and right-leaning users were extremely limited (Conover, et al., 2011). Both studies have been taken as relevant empirical validations of the so-called cyber-balkanization, a social phenomenon that occurs when Internet users form isolated groups around specific interests, e.g. politics. This concept is closely related to the idea of echo chambers, in which people are "mainly listening to louder echoes of their own voices" (Sunstein, 2009) and, therefore, reinforce division in social media. Indeed, online polarization is not only a particular feature of U.S. politics but also a social behaviour observed in a diverse range of countries, e.g. Canada (Gruzd & Roy, 2014) and Germany (Feller, Kuhnert, Sprenger, & Welpe, 2011). In Spain, previous studies of the Twitter networks related to recent elections also showed evidence of online polarization, e.g. in the 2010 Catalan election (Congosto, Fernández, & Moro Egido, 2011) and in the 2011 Spanish elections (Borondo, Morales, Losada, & Benito, 2012) (Aragón, Kappler, Kaltenbrunner, Laniado, & Volkovich, 2013).
In this study, we first measure the polarization of the network, detect the online diffusion sub-network of each party, and identify the users who build bridges between these clusters. Then, we analyse the diffusion networks of each of the detected clusters to characterise the social structure of the corresponding parties. The analysis of the social structures extends the framework introduced in (Garcia, Abisheva, Schweighofer, Serdult, & Schweitzer, 2015) which focuses on three dimensions: hierarchical structure, effective diffusion and social resilience.
II.1 Data preparation
Here, we describe the construction of the network of retweets and introduce a data-driven framework to extract the clusters corresponding to the political parties.
II.1.1 Network construction
Data were collected from Twitter in relation to the campaign for the 2015 Barcelona City Council election (May 1-26, 2015). We defined a list of Twitter accounts of the seven main political parties:
- Barcelona en Comú (BeC),
- Convergència i Unió (CiU),
- Ciudadanos (Cs),
- Capgirem Barcelona (CUP),
- Esquerra Republicana de Catalunya,
- Partit Popular de Catalunya (PP),
- Partit dels Socialistes de Catalunya (PSC).
We also added the Twitter accounts for corresponding candidates for Mayor and each member party for the coalitions CiU, BeC and CUP. The users of that list can be found in Table I. From the Twitter Streaming API, we extracted 373,818 retweets of tweets that (1) were created by, (2) were retweeted by, or (3) mentioned a user from the list.
II.1.2 Community detection
We first executed the standard Louvain method and found 151 clusters and achieved a modularity value of 0.727. From Figure 12 we observed a clear difference between the 8 largest clusters (size ∈ [232, 1981]) and the remaining 143 clusters (size ∈ [2, 62]). In order to label these 8 clusters, we manually inspected the most relevant users from each cluster according to their PageRank value within the full network (the top five users for each cluster are listed in Table 2. The results indicate that the community detection method identified a single cluster for almost each party: BeC = c₁, c4; ERC = c2; CUP = C3; Cs = c5; CiU = c6; PP = C7 and PSC = C8. The only exception for such rule is that BeC is composed of two clusters. The manual inspection of the users from these two clusters revealed that cluster c₁ is formed by the official accounts of the party (e.g. @bcnencomu, @ahorapodemos), allied parties (e.g. @ahoramadrid), the candidate (@adacolau) and a large community of peripheral users. Cluster C4 is composed of activists engaged in the digital communication for the campaign (e.g. @toret, @santidemajo, @galapita). That is to say that the most visible accounts from the media perspective belong to c/ while c4 is formed by party activists, many of them related to the 15M movement. For this reason, from now on, we distinguish these clusters as "BeC-p" and "BeC-m", party and movement respectively.
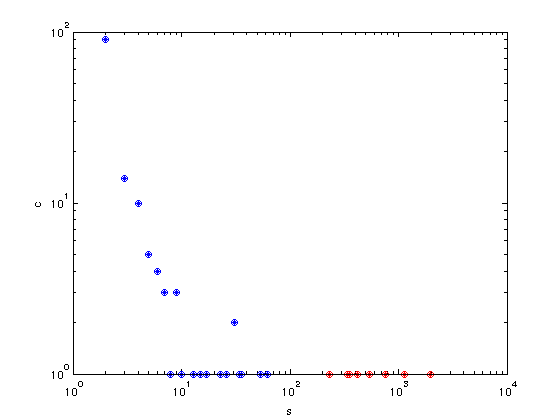
Figure 12. Distribution of the number of clusters (c) by size (s). Red markers are used to indicate the 8 largest clusters.
| Political Party / Coalition |
Party account(s) |
Candidate account |
| BeC |
@bcnencomu @icveuiabcn @podem_bcn @equobcn @pconstituentbcn |
@adacolau |
| CiU |
@cdcbarcelona @uniobcn |
@xaviertrias |
| Cs |
@cs_bcna |
@carinamejias |
| CUP |
@capgirembcn @cupbarcelona |
@mjlecha |
| ERC |
@ercbcn |
@alfredbosch |
| PP |
@ppbarcelona_ |
@albertofdezxbcn |
| PSC |
@pscbarcelona |
@jaumecollboni |
Table 1. Twitter accounts of the selected political parties and candidates.
From this collection of retweets, we built a directed weighted graph comprising a set of nodes (users) and a set of edges (retweets between any pair of users). The weight of each edge was the number of retweets from the source node to the target node. To exclude anecdotal interactions between users and highlight the structure of the expected clusters, we only kept the interactions between any pair of nodes that occurred at least 3 times: an edge from user A to user B implied that user A has retweeted at least three times user B in our dataset. Nodes without edges after this process were removed. The resulting network comprises 6,492 nodes and 16,775 edges.
Traditionally, community detection is performed by applying a clustering algorithm. We chose the Louvain method (Blondel, Guillaume, Lambiotte, & Lefebvre, 2008), which is commonly used because of its high performance in terms of efficiency and accuracy. Like many clustering algorithms, however, this method results into problems when defining boundaries between clusters: it assigns each node to one cluster, and also nodes that do not strongly belong to any cluster are assigned to one. The algorithm's outcome depends on the particular execution that is considered. This means that a node that appears to belong to a certain cluster could fall in another cluster if we run the algorithm another time. To solve this issue, we have designed an adapted version of the Louvain method: the algorithm is executed
| Cluster id |
Cluster label |
User |
PageRank |
Role |
| C1 |
BeC-p |
@bcnencomu |
0.092 |
BeC party account |
| C1 |
BeC-p |
@adacolau |
0.029 |
BeC candidate |
| C1 |
BeC-p |
@ahoramadrid |
0.009 |
BeC allied party account |
| C1 |
BeC-p |
@ahorapodemos |
0.009 |
BeC member party account |
| C1 |
BeC-p |
@elperiodico |
0.005 |
media |
| C2 |
ERC |
@ercbcn |
0.016 |
ERC party account |
| C2 |
ERC |
@alfredbosch |
0.011 |
ERC candidate |
| C2 |
ERC |
@naciodigital |
0.009 |
media |
| C2 |
ERC |
@arapolitica |
0.007 |
media |
| C2 |
ERC |
@esquerra_erc |
0.004 |
ERC party account |
| C3 |
CUP |
@cupbarcelona |
0.016 |
CUP party account |
| C3 |
CUP |
@capgirembcn |
0.008 |
CUP party account |
| C3 |
CUP |
@albertmartnez |
0.005 |
media |
| C3 |
CUP |
@encampanya |
0.003 |
media |
| C3 |
CUP |
@mjlecha |
0.002 |
CUP candidate |
| C4 |
BeC-m |
@toret |
0.014 |
BeC member |
| C4 |
BeC-m |
@santidemajo |
0.005 |
BeC member |
| C4 |
BeC-m |
@sentitcritic |
0.005 |
media |
| C4 |
BeC-m |
@galapita |
0.005 |
BeC member |
| C4 |
BeC-m |
@eloibadia |
0.005 |
BeC member |
| C5 |
Cs |
@carinamejias |
0.007 |
Cs candidate |
| C5 |
Cs |
@cs_bcna |
0.006 |
Cs party account |
| C5 |
Cs |
@ciudadanoscs |
0.004 |
Cs party account |
| C5 |
Cs |
@soniasi02 |
0.003 |
Cs member |
| C5 |
Cs |
@prensacs |
0.002 |
media |
| C6 |
CiU |
@xaviertrias |
0.012 |
CiU candidate |
| C6 |
CiU |
@ciu |
0.004 |
CiU party account |
| C6 |
CiU |
@bcn_ajuntament |
0.003 |
institutional |
| C6 |
CiU |
@ramontremosa |
0.002 |
CiU member |
| C6 |
CiU |
@cdcbarcelona |
0.002 |
CiU party account |
| C7 |
PP |
@btvnoticies |
0.011 |
media |
| C7 |
PP |
@cati_bcn |
0.003 |
media |
| C7 |
PP |
@albertofdezxbcn |
0.003 |
PP candidate |
| C7 |
PP |
@maticatradio |
0.002 |
media |
| C7 |
PP |
@ppbarcelona_ |
0.002 |
PP party account |
| C8 |
PSC |
@elsmatins |
0.006 |
media |
| C8 |
PSC |
@pscbarcelona |
0.003 |
PSC party account |
| C8 |
PSC |
@sergifor |
0.003 |
media |
| C8 |
PSC |
@jaumecollboni |
0.002 |
PSC candidate |
| C8 |
PSC |
@elpaiscat |
0.002 |
media |
Table 2. Top 5 users for the 8 largest clusters according to their PageRank value within the full network (clusters are ordered by size).
Furthermore, we found a remarkable presence of accounts related to media in Table 2 for almost every cluster. As we noted above, we aim to study the ecosystem of each political party, i.e. including only nodes that are reliably assigned to them. To this end, we applied the adapted version of the Louvain method that is described in Section of Methods: we ran the algorithm 100 times and assigned to each cluster only the nodes that fell into that cluster more than 95 times. By inspecting the results of the 100 executions, we found the presence of 8 major clusters, much bigger than the others, as a constant element. The composition of these clusters is also quite stable: 4,973 nodes (82.25%) are assigned to the same cluster in over 95 executions.
Among the remaining nodes, which could not be reliably assigned to any of the major clusters, we find that many accounts are media. We additionally identified the most relevant users, according to PageRank, in the sub-network formed only by edges between nodes from different clusters (i.e. "weak ties" (Granovetter, 1973)). Table 3 presents the 25 most relevant users in this sub-network and confirms that media played a key role in connecting different clusters.
| User |
Page Rank |
Role |
| @btvnoticies |
0.014 |
media |
| @bcnencomu |
0.012 |
party |
| @sicomtelevision |
0.010 |
media |
| @cupbarcelona |
0.007 |
party |
| @elsmatins |
0.007 |
media |
| @capgirembcn |
0.006 |
party |
| @tv3cat |
0.006 |
media |
| @324cat |
0.006 |
media |
| @xaviertrias |
0.005 |
candidate |
| @puntcattv3 |
0.005 |
media |
| @revolucio1984 |
0.004 |
citizen |
| @sergifor |
0.004 |
media |
| @nuriapujadas |
0.004 |
media |
| @annatorrasfont |
0.004 |
media |
| @arapolitica |
0.004 |
media |
| @maticatradio |
0.003 |
media |
| @cati_bcn |
0.003 |
media |
| @elpaiscat |
0.003 |
media |
| @encampanya |
0.003 |
media |
| @albertmartnez |
0.002 |
media |
| @naciodigital |
0.002 |
media |
| @adacolau |
0.002 |
candidate |
| @ramontremosa |
0.002 |
party member |
| @alfredbosch |
0.002 |
candidate |
| @directe |
0.001 |
media |
Table 3. Most relevant nodes by PageRank in the sub-network formed by edges between nodes from different clusters.
II.2 Results
So far we have described the way diffusion network was constructed and the ways it was divided into cluster corresponding to major political parties. For the next steps we focus on polarization of the network during the campaign and compare structural peculiarities of the largest clusters in the following dimensions: hierarchical structure, effective diffusion, and social resilience.
II.2.1 Polarization
Similar to the previous findings for online political networks we detected a high level of polarization when calculated modularity (Q=0.727) or the first execution of standard Louvain method as described before. The boundaries between ideological online communities are visible in Figure 13, where we visualized the resulting graph partitioning for N=100 and □=0.05. For a better readability of the network, we only considered the giant component of the graph and applied the Force Atlas 2 layout algorithm (Jacomy, 2011) to enforce cluster graph drawing.
As one could expect in any polarized scenario, the largest number of interaction links happened within the same cluster. There was however a notably large number of links between the two clusters of BeC (BeC-p and BeC-m). To further prove the low levels of interactions between major parties we made an interaction matrix A, where Aij counts all retweets that accounts assigned to cluster i made for the tweets from users of cluster j. Since the clusters are of the different size, we then normalized Aij's by the sum of the all retweets made by the users assigned to cluster i. From Figure 14, where we draw matrix A, we confirmed that a vast majority of retweets were made between users from the same cluster (main diagonal). For Barcelona en Comú we found a presence of communication between movement and party clusters with a prevalence from BeC-m to BeC-p (0.18, the largest value out of the main diagonal).
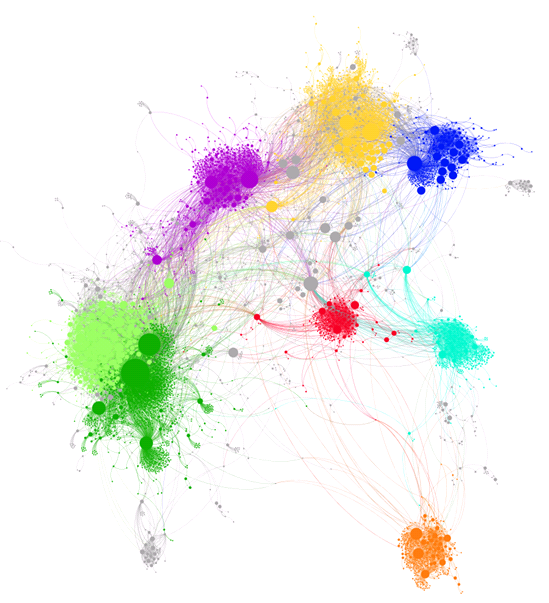
Figure 13. Network of retweets (giant component). Clusters are represented by colour: BeC-p in dark green; BeC-m in light green; ERC in yellow; PSC in red; CUP in violet; Cs in orange; CiU in dark blue; PP in cyan. The nodes out of these clusters are grey-colored.
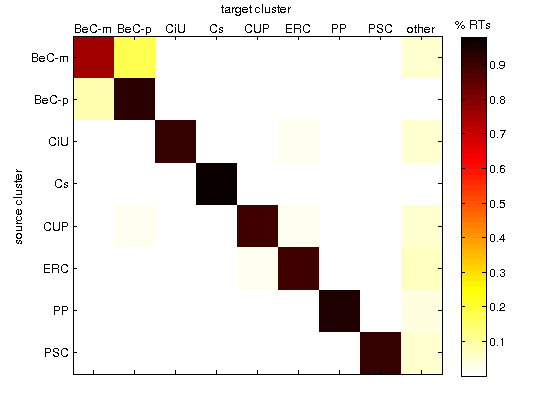
Figure 14. Normalized weighted adjacency matrix of the network of clusters.
II.2.2 Structure of the party clusters
Inspired by the framework introduced in (Garcia, Abisheva, Schweighofer, Serdult, & Schweitzer, 2015) we proposed to compare the topology of the intra-network of each cluster in terms of hierarchical structure, information efficiency, and social resilience.
II.2.2.1 Hierarchical structure
To evaluate the hierarchical structure we measured the in-degree inequality of each cluster based on the Gini coefficient. We also calculated in-degree centralization suggested in (Garcia, Abisheva, Schweighofer, Serdult, & Schweitzer, 2015), however found it uninformative in the case of high variability of the data.
From results in Table 4 we saw a notable divergence between these hierarchical metrics: the inequality values of CiU and PP are similar (Gin=0.893 and Gin=0.876, respectively), but PP centralization (Cin=0.378) is far from the maximum centralization value exhibited by CiU (Cin=0.770). For Barcelona en Comú, BeC-m emerges as the least unequal and the least centralized structure, while BeC-p forms the most unequal cluster (Gin=0.995). We also plotted the Lorenz curve of the in-degree distribution of the clusters in Figure 15 to visually validate the different levels of inequality among clusters that were presented in Table 4.
It is easy to demonstrate that for networks with a heavy tailed in-degree distribution (as the ones of this study) the in-degree centralization formulated in (Freeman, 1979) is approximately equal to the ratio between the maximum in-degree and the number of nodes . Therefore, this metric is not a good one to capture hierarchical structure for social diffusion graphs, and Gini coefficient for in-degree inequality represents a more reliable measure.
| Cluster |
Gin |
Cin |
| BeC-p |
0.995 |
0.639 |
| Cs |
0.964 |
0.476 |
| ERC |
0.954 |
0.452 |
| CUP |
0.953 |
0.635 |
| CiU |
0.893 |
0.770 |
| PP |
0.876 |
0.378 |
| PSC |
0.818 |
0.565 |
| BeC-m |
0.811 |
0.290 |
Table 4. Inequality based on the Gini Coefficient (Gin) and centralization (Cin) of the in-degree distribution of each cluster.
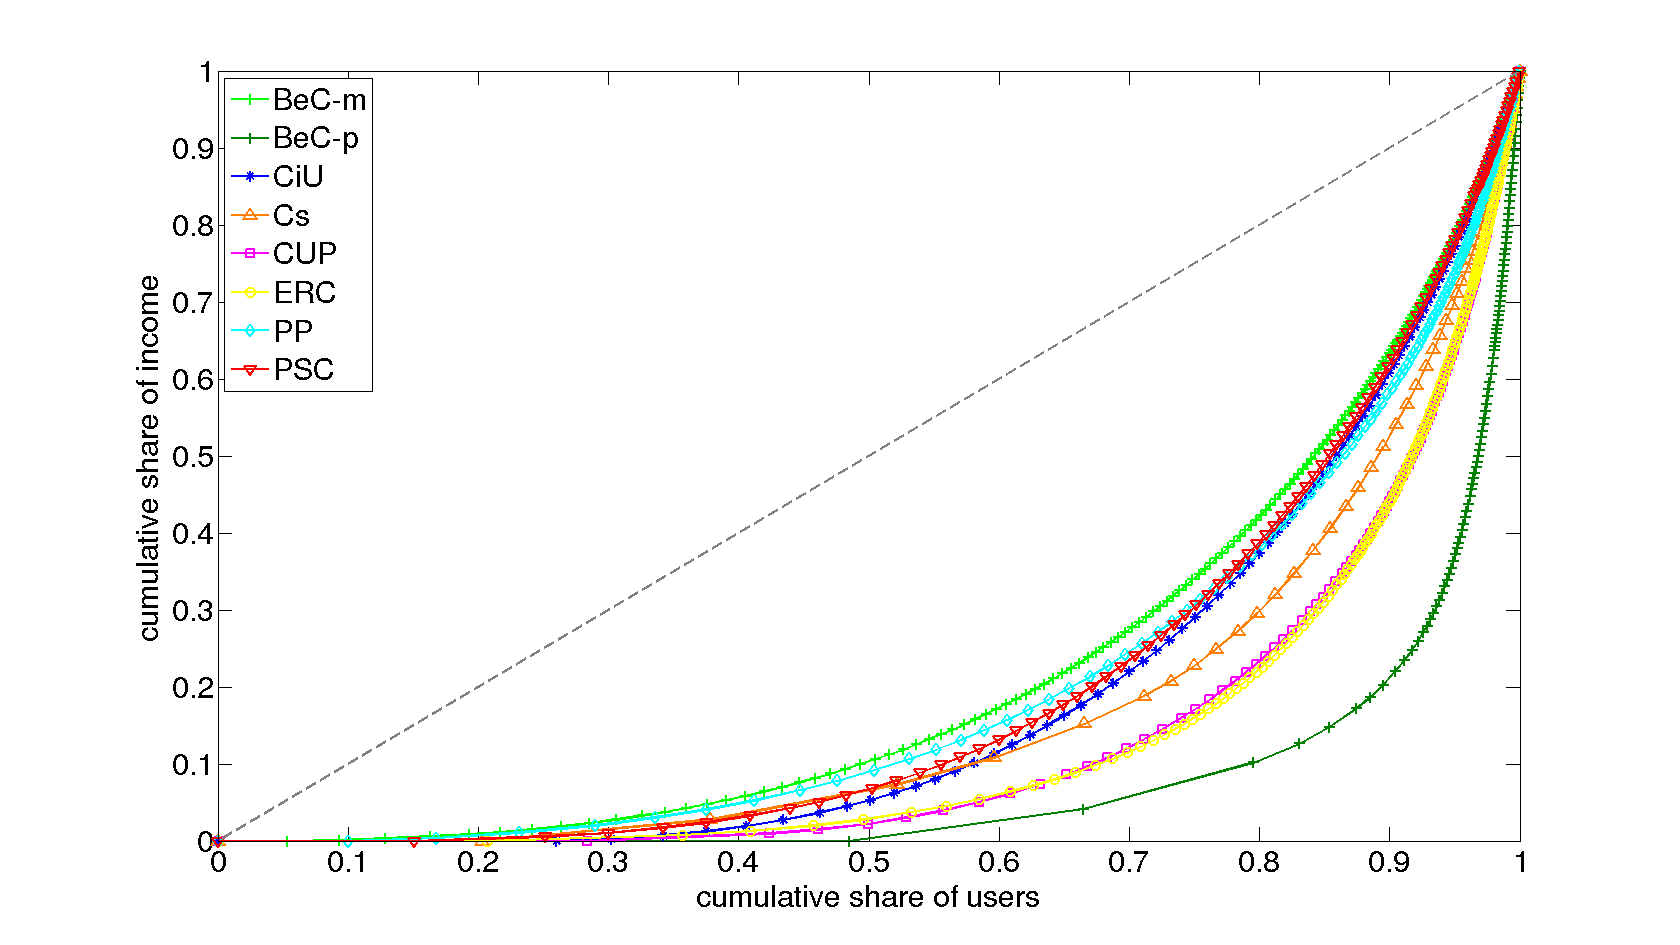
Figure 15. Lorenz curve of the in-degree distribution of each cluster.
II.2.2.2 Information efficiency
Broadly speaking the efficiency of a network aims to measure its small-world property, i.e. phenomenon of strangers being linked by a mutual acquaintance. To assess the efficiency of information transportation within each party cluster we computed the average path length and the clustering coefficient. Small-world networks tend to have a small average shortest path length and a clustering coefficient significantly higher than expected by random chance (Watts & Strogatz, 1998).
From Table 5 we observe that BeC-m has the highest clustering coefficient (Cl=0.208) closely followed by PP and PSC, the two smallest clusters by size. On the contrary the clustering coefficient of BeC-p is almost 0. This finding could be explained by the topology of BeC-p, roughly formed by stars whose centre nodes are the most visible Twitter accounts of Barcelona en Comú: the party official accounts and the candidate.
We do not observe a remarkable pattern regarding the average path length. It is lower than 3 for the majority of the party clusters with the PSC cluster having the lowest value (l=2.29). In the same time ERC, CiU and BeC-m expose the longest average path length (5.43, 4.66, and 3.35 respectively).
| Cluster |
N |
E |
CI |
l |
| BeC-m |
427 |
2431 |
0.208 |
3.35 |
| PP |
301 |
1163 |
0.188 |
2.73 |
| PSC |
211 |
810 |
0.182 |
2.29 |
| CiU |
337 |
1003 |
0.114 |
4.66 |
| Cs |
352 |
832 |
0.073 |
2.57 |
| CUP |
635 |
1422 |
0.037 |
2.57 |
| ERC |
866 |
1899 |
0.027 |
5.43 |
| BeC-p |
1844 |
2427 |
0.002 |
2.48 |
Table 5. Number of nodes (N) and edges (E), clustering coefficient (CI) and average path length (l) of the intra-network of each cluster.
II.2.2.3 Social resilience
The concept of social resilience is the ability of a social group to withstand external stresses. To measure social resilience for a social network we applied the k-core decomposition for each cluster and evaluated the distributions of the nodes within each k-core .
In Table 6 we present maximal and average k-indexes for each cluster and Figure 16 visually shows the corresponding distributions. As in the case of hierarchical structure and information efficiency we observed a remarkable difference between BeC-m (kmax=17, kavg=5.90) and BeC-p (kmax=5, kavg=1.33), that are the highest and lowest values respectively. In comparison to the other parties we saw clear differences between node distributions for both, BeC-m and BeC-p, and the rest (the largest concentration of the nodes is in the first k-cores and considerable part is in the inner most cores). Therefore, the movement group of Barcelona en Comú is an online social community with an extreme ability to withstand or recover. In the same time the party group of Barcelona en Comú seems to only focus on the core users.
| Cluster |
Kmax |
Kavg |
| BeC-m |
17 |
5.90 (5.46) |
| PP |
12 |
4.02 (3.99) |
| PSC |
11 |
3.85 (3.55) |
| CiU |
13 |
3.10 (3.44) |
| ERC |
8 |
2.25 (1.85) |
| Cs |
10 |
2.42 (2.42) |
| CUP |
10 |
2.19 (2.22) |
| BeC-p |
5 |
1.33 (0.71) |
Table 6. Maximal and average k-index (standard deviation in parentheses) for the intra-network of each cluster.
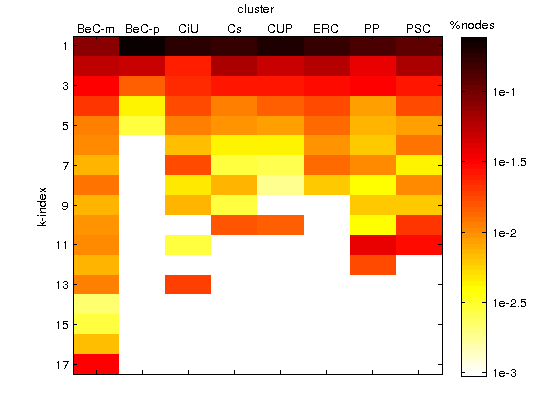
Figure 16. Distribution of the nodes per cluster (column) and k-index (row). Cells are colored to form a heat map indicating the density (log scale).
11.3 Discussion
In this section, we discuss the results from examining the structures on Twitter of the political parties in the 2015 Barcelona City Council election.
II.3.1 Institutionalisation of a networked movement
Our research question deals with the kind of organizational structure that Barcelona en Comú developed for the campaign. On the one hand, the cited literature (González-Bailón, Borge-Holthoefer, Rivero, & Moreno, 2011) (Toret, et al., 2015) provided evidence of the decentralization of the 15M movement, which inspired the Barcelona en Comú candidacy. On the other hand, many political scientists (Michels, 1915) (Pareto, 1935) (Mosca, Livingston, & Kahn, 1939) (Mills, 1999) argued that parties are historically ruled by elites and, therefore, result in centralized organizations. Furthermore, the historical models of political parties reviewed in (Katz & Mair, 1995) (i.e. Caucus parties, Mass parties, Catch-all parties, and Cartel parties) always assumed organization around elites. All of these observations motivated us to study whether Barcelona en Comú preserved a decentralized structure or adopted a conventional centralized organization.
Our results depict a movement-party structure in which the two components form well-defined clusters. In comparison to the clusters of the rest of political parties, we found the BeC movement community as the least hierarchical, better clustered and most resilient one. In contrast, the BeC party community emerges as the most hierarchical, least clustered and least resilient one. The centralization of the party cluster points to the candidate and official accounts, the subjects that are commonly associated with the elite. However, unlike the rest of political parties, there is a co-existence of both party and movement clusters. This co-existence is consistent with the hypothesis expressed in (Toret, 2015) when defining Podemos, member party of Barcelona en Comú, as the conjugation of a front-end and a back-end.
In this article we have characterised the organization of political parties according to their online diffusion networks. Some authors have reported that the Internet played a key role in the organization of the 15M movement for building "a hybrid space between the Internet social networks and the occupied urban space" (Castells, 2013). According to (Toret, et al., 2015), this hybrid space is the result of technopolitical practices: “the tactical and strategic use of technological devices (including social networks) for organization, communication and collective action". Are technopolitics the origin of this particular movement-party partition of Barcelona en Comú? Recently, political scientists have postulated the emergence of cyber parties “with its origins in developments in media and information and communication technologies" (Margetts, 2001). Although we cannot ensure that the Internet is the only reason behind this new form of political organization, in this particular context some party activists reported that ICT technologies becomes essential for campaigning (Sandiumenge, 2015). Therefore, we are convinced of the close link between technopolitics and the structure of Barcelona en Comú.
II.3.2 Online polarization
The identification of the different clusters was made possible by the high level of polarization that the network exhibited, as we initially expected. We observed that bridges between clusters (i.e. "weak ties" (Granovetter, 1973) were mostly built by accounts related to media. Because media accounts hardly retweet content from other accounts, a great amount of weak ties consists of users from political clusters retweeting content published by media accounts. This means that media play a key role in generating messages that build a public sphere. Some theorists suggest that the best response to group polarization is the usage of "mechanisms providing a public sphere" (Sunstein, 2009). We found that the most relevant account in the sub-network of weak ties was @btvnoticies, the local and publicly owned television. Indeed, this TV channel organized the debate among the candidates of five of the seven parties. Figure 17 presents the ego-networks of four media accounts: @btvnoticies, @arapolitica @elpaiscat and @naciodigital. We clearly observe that @btvnoticies is linked from every party while the other 3 private media are only linked from specific clusters. This finding might indicate that public TV became more plural than the other three analysed private media, and pluralism is an effective tool to get "people exposed to a range of reasonable competing views” (Sunstein, 2009).
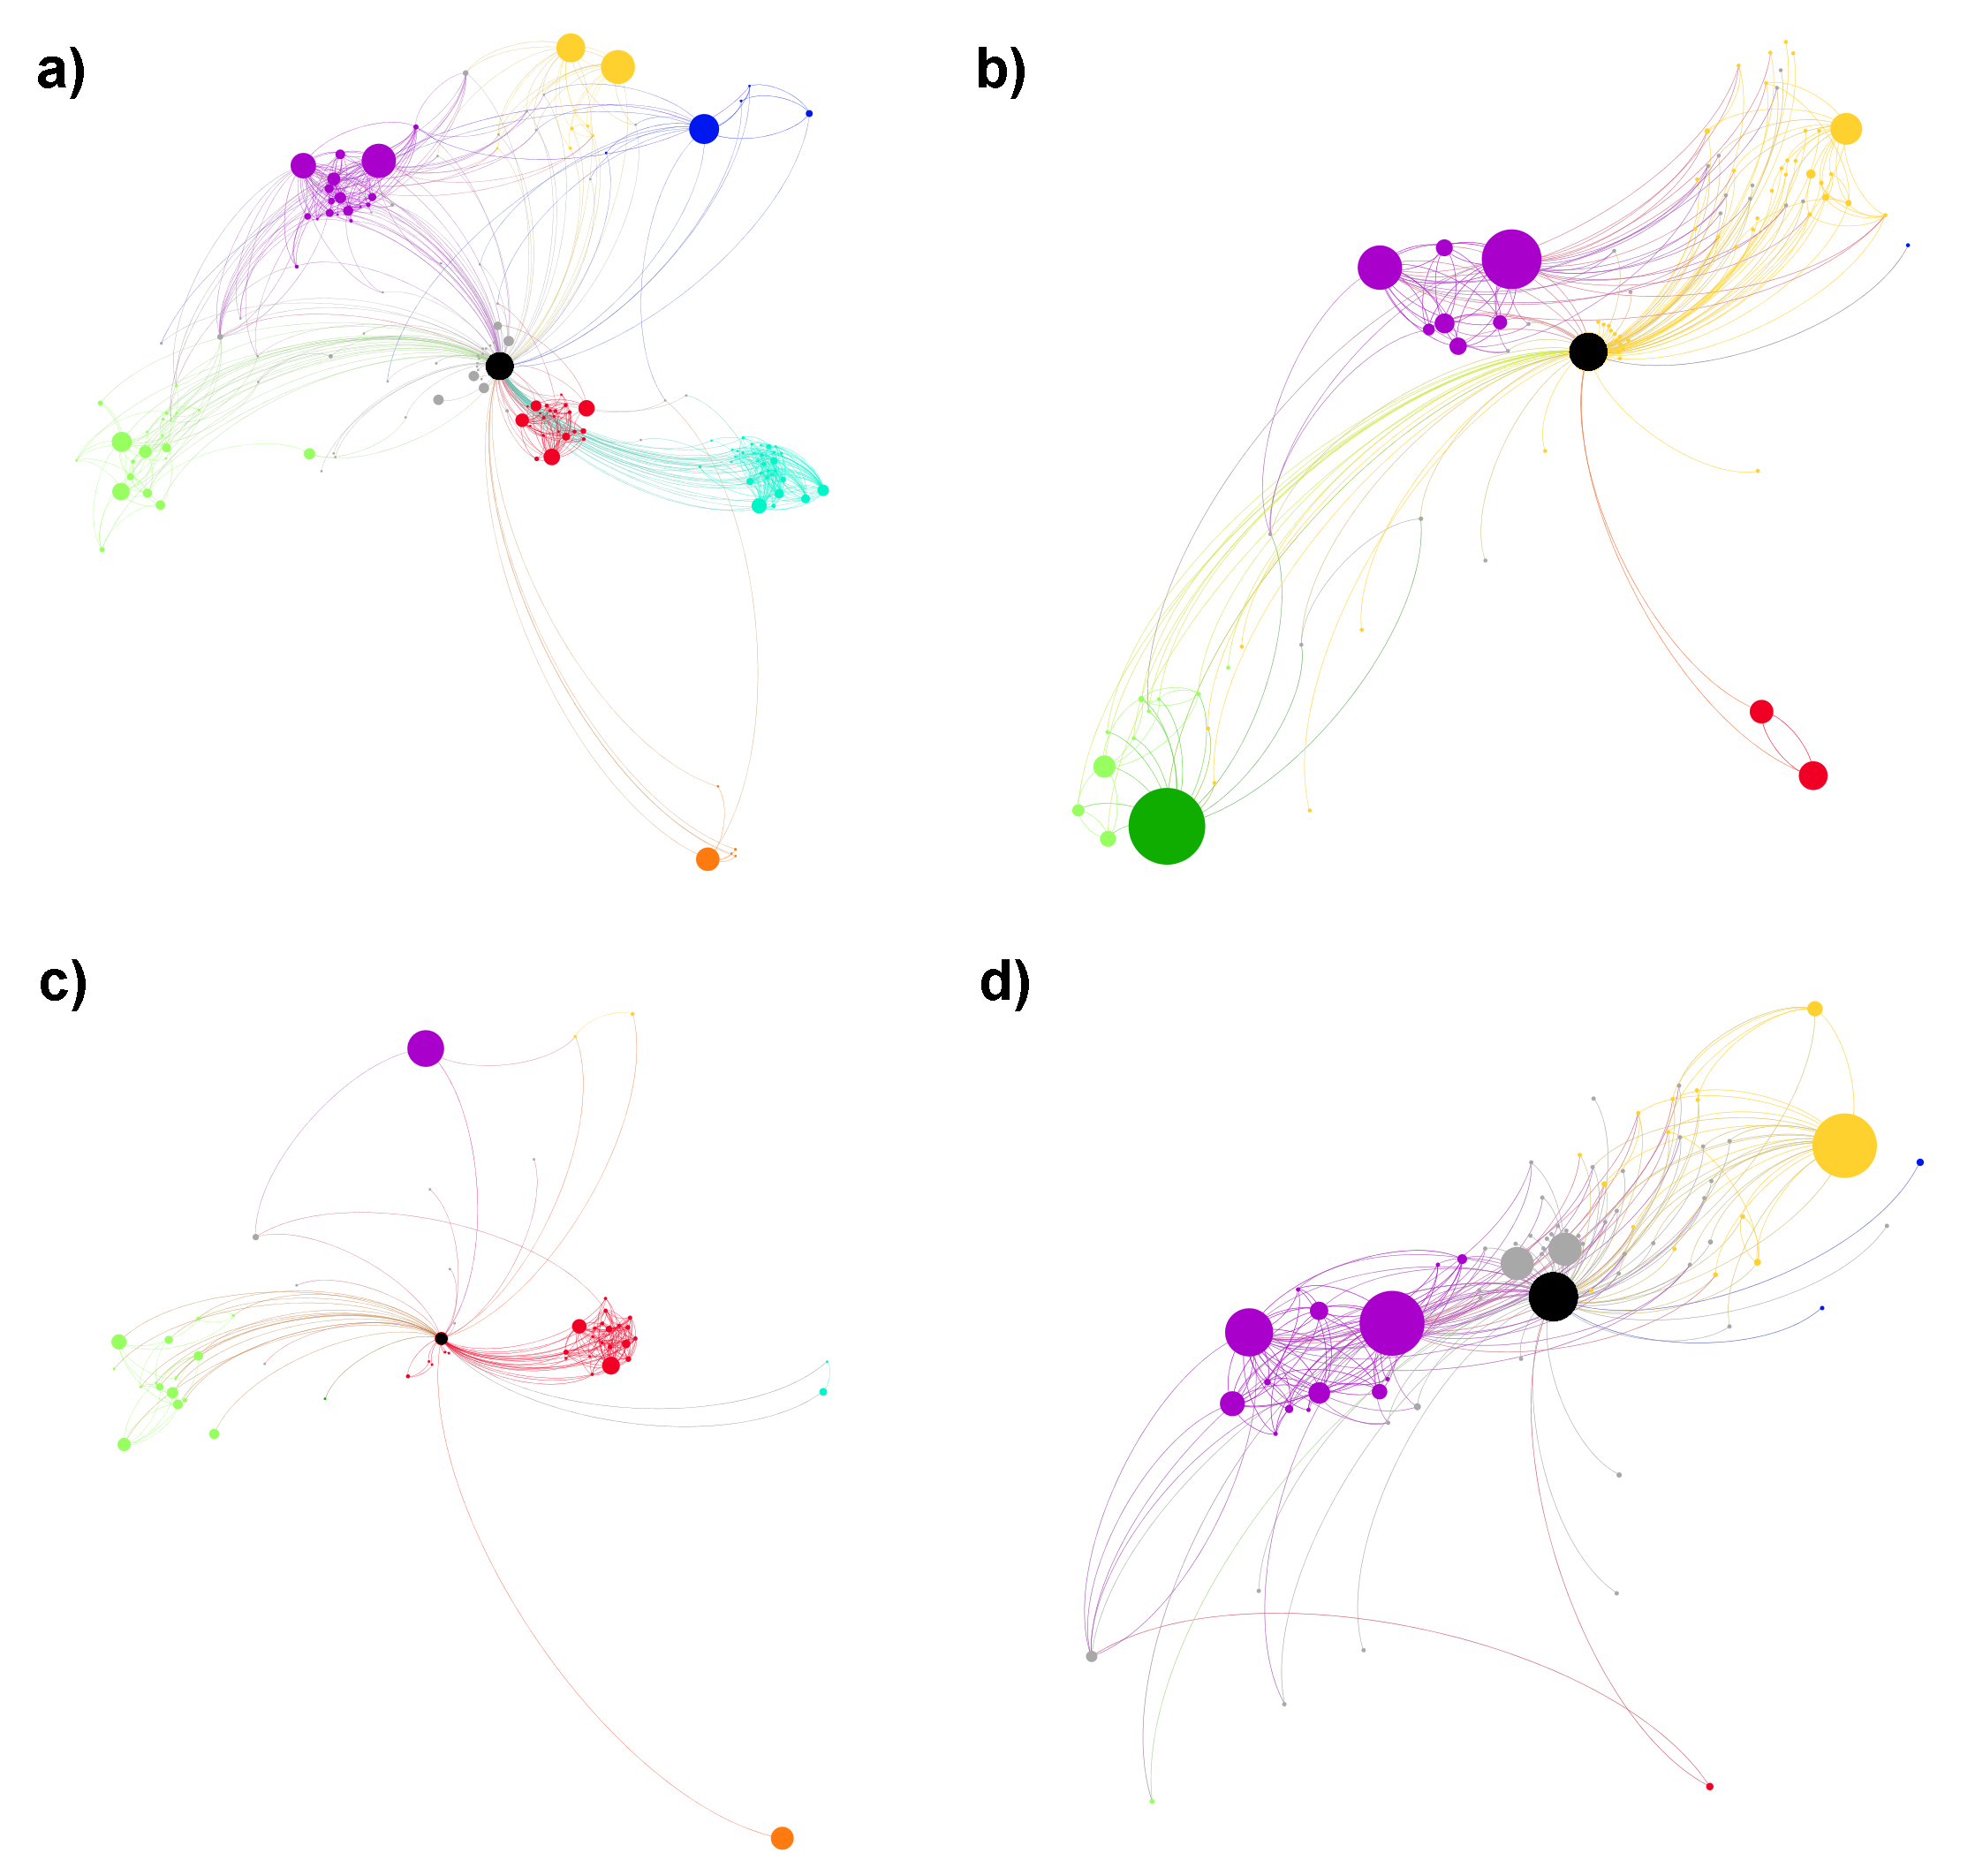
Figure 17. Ego-networks of 4 media accounts: a) @btvnoticies; b) @arapolitica; c) @elpaiscat; d) @naciodigital. Central nodes (i.e. corresponding media accounts) are black-colored.
11.4 Conclusions
In this study we have examined the Twitter networks of Barcelona en Comú in comparison to the other parties for the 2015 Barcelona municipal elections. We observed that the tension between the decentralization of networked movements and the centralization of traditional political parties results into a movement-party structure: the two paradigms co-exist in two well-defined clusters. From this result, we find of interest to further investigate the origin of this particular structure:
- Did the structure of Barcelona en Comú result from the confluence of minor parties and the 15M activists?
- Instead of evolving into a centralized organization, did the 15M networked movement implement a party interface over its decentralized structure?
Further longitudinal analyses of the formation of these networks could help us to provide answer to these open questions.
It is interesting to note that city council elections were held in every Spanish city in May 2015 and candidacies similar to Barcelona en Comú were built. Moreover, after these elections, the city councils of several of the largest Spanish cities are ruled by these new organizations (e.g. Ahora Madrid, Zaragoza en Común). For this reason, future work should replicate this analysis to examine whether the characteristics that we observed in Barcelona en Comú are also present in these other grassroots movement-parties.
11.5 Methods
In this analysis we have used methods of social network analysis for community detection, identification of relevant nodes, and measurement of the topological structure of a network.
II.5.1 Community detection
II.5.1.1 Modularity
The modularity measures the density of edges inside communities in comparison to edges between communities (Newman, 2004). Its value, between - I and I, is defined as:
$Q = \frac{1}{2m} \Sigma_{ij} [ A_{ij} - \frac{k_i k_j}{2m} ] \delta(c_i, c_j)$
Here Aij is the edge weight between nodes i and j; ki and kj are the degrees of the nodes i and j, respectively; m represents the total number of edges in the graph. ci; and cj are the communities of the nodes and δ is a simple delta function.
II.5.1.2 Louvain Method
The Louvain Method is a community detection technique based on a greedy algorithm that attempts to optimize the modularity of a partition of a given network (Blondel, Guillaume, Lambiotte, & Lefebvre, 2008). The method follows a two-step approach.
First, each node is assigned to its own community. Then, for each node i, the change in modularity is measured for moving i from its own community into the community of each neighbour j:
$\Delta Q = [ \frac{E_{in} + k_{i,in}}{2m} - \frac{(\Sigma_{tot} + k_i)^2}{2m} ]$
where Ein is sum of all the weights of the intra-edges of the community where i being moved into, Σtot is the sum of all the weights of the edges to nodes of the community, ki is the degree of i, ki,in is the sum of the weights of the edges between i and other nodes in the community, and m is the sum of the weights of all edges in the network. Once this value is measured for all communities that i is connected to, the algorithm locates i into the community that produces the largest increase in modularity. If no increase is
Project no. 610349
D-CENT: Decentralised Citizens Engagement Technologies
D2.3 Collective Intelligence Framework
Sept. 30, 2015
Version Number: 1
Authors:
- Pablo Aragón
- Rosa Borge
- Antonio Calleja-López
- Andreas Kaltenbrunner
- David Laniado
- Arnau Monterde
- Yana Volkovich
Editors and reviewers:
- Stefano Lucarelli
- Francesca Bria
The work leading to this publication has received funding from the European Union's Seventh Framework Programme (FP7/2007-2013) under grant agreement n° 610349.
The content of this report reflects only the author's view and that the Commission is not responsible for any use that may be made of the information it contains.
D2.3 Results of the data analysis
possible, i remains in its original community. This process is applied iteratively until modularity cannot be
increase and a local maximum of modularity is achieved.
In the second step, the method groups all of the nodes from the same community and builds a new
network where nodes are the communities from the previous step. Edges between nodes of the same
community are represented by self-loops and edges from multiple nodes from the same community to a
node of a different community are represented by weighted edges between corresponding communities.
First and second steps are repeated until modularity cannot be increased.
ADAPTED VERSION TO ENHANCE THE ROBUSTNESS OF THE LARGEST CLUSTERS
Like most community detection methods, the Louvain method consists of a greedy algorithm and has a
random component, so each execution produces a different result. To obtain robust results, avoiding
dependency on a particular execution of the algorithm, we introduce the following method to identify
the main clusters of the network in a stable way.
First, we run N executions of the Louvain algorithm, which produce N different partitions of the
network into clusters. Then we select the bigger clusters for each partition, and identify each cluster
through its most representative nodes. In particular, as we expect that the main clusters will represent
the political parties, we identify each cluster with the most central node corresponding to the account
of a political party or of a political party leader. Finally, we assign to each cluster all the nodes that
appear in that cluster in at least the (1-ε) of the partitions created, where (1-ε) represents the
confidence interval.
This procedure allows us to validate the results of the community detection algorithm, and to guarantee
that all the nodes that are assigned to a cluster do actually belong to it with high confidence. The
remaining nodes, that cannot be assigned in a stable way to any of the main clusters, are left out from all
the clusters.
PageRank is a global characteristic of a node participation in some network and could be seen as a
characteristic of node's success and popularity (Brin & Page, 2012). It is defined as a stationary
distribution of a random walk on the directed graph. At each step, with probability c, the random walk
follows a randomly chosen outgoing edge from a node, and with probability (1-c) the walk starts afresh
from a node chosen uniformly among all nodes. The constant c is called damping factor, and takes values
between 0 and 1 (traditionally c=0.85). PageRank can be summarized in the following formula:
$$
PR(i) = c \sum_{j \to i} \left(\frac{1}{d_j}\right) PR(j) + \frac{1-c}{n}
$$
where PR(i) is the PageRank of node i, d_j is out-degree of node j, the sum is taken over all nodes j that
link to node i, and n is the number of nodes in the network. Unlike in- and out-degree which are local
characteristics, the PageRank is a global characteristic of a node. In other words, adding/removing an
edge between two nodes could affect PageRank values of many nodes.
11.5.3 Network topology
11.5.3.1 In-degree Distribution
The in-degree of node i is the total number of edges onto node i. By counting how many nodes have
each in-degree value, the in-degree distribution P(k_in) is equal to the fraction of nodes in the graph with
such in-degree k_in. The cumulative in-degree distribution P(K ≥ k_in) represents the fraction of nodes in
the graph whose in-degree is greater than or equal to k_in.
11.5.3.2 In-degree Centralization
An existing method to measure degree centralization was introduced by (Freeman, 1979) and is based on
two concepts: (1) how the centrality of the most central node exceeds the centrality of all other nodes
and (2) setting the value as a ratio by comparing to a star network:
$$
C_{in} = \frac{\sum_{i=1}^{n-1}(k_{in} – k_{in}^ )}{\max \sum_{i=1}^{n-1}(k_{in} – k_{in}^ )}
$$
where k_in; is the in-degree of node i, k_in* is the maximum in-degree of the network and max Σ^(n-1)_(i=1)(k_in -
k_in) is the maximum possible sum of differences for a graph with the same number of nodes (a star
network).
11.5.3.3 In-degree Inequality: Gini coefficient
The Gini coefficient is a statistical metric to quantify the level of inequality given a distribution (Gini,
1912). It was initially formulated in Economics to measure the income distribution by using the Lorenz
curve. If A is the area between the line corresponding perfect equality and B is the area under the
Lorenz curve, the Gini coefficient is equal to A / (A+B). If the Lorenz curve is expressed by the function Y
= L(X), B is calculated as follows:
$$
G = 1 - 2 \int_0^1 L(X)dX
$$
In the context of network topology, the Gini coefficient can be applied to characterize the hierarchical
structure of a network based on the inequality of its in-degree distribution.
11.5.3.4 Clustering coefficient
Clustering coefficient measures the extent of nodes to cluster together by calculating the number of
triangles in the network. For every node i we set N_i to be the neighbourhood, i.e. N_i={ j∈V: (i,j) ∈ E},
and define the local clustering coefficient as
$$
Cl_i = \frac{2 |(j, k) \in E : j, k \in N_i|}{k_i (k_i - 1)}
$$
Then, following (Watts & Strogatz, 1998) the clustering coefficient is just the average of the local
clustering coefficients: CI = Σ_i Cl_i / n, where n is the number of nodes in the network.
11.5.3.5 Average path length
The concept of average path length aims to measure the efficiency of information propagation in a social
network by taking the mean value of the number of edges along the shortest paths for all possible pairs
of nodes. In more details, for every pair of nodes i,j we set d_ij to be the smallest number of steps among
all directed paths between i and j and d_ij=0 if there is no such path. Then, the average path length is
defined as follows:
$$
l = \frac{\sum (d_{ij})}{n (n - 1)}
$$
11.5.3.6 k-core decomposition
The k-core of a graph is the maximal subgraph in which each vertex is adjacent, ignoring the direction of
the edge, to at least k other nodes of the subgraph. A graph's node has a k-index equals to k if it belongs
to the k-core but not to the (k+1)-core. Thus, a given network, we define a sub-network H induced by
the subset of users C. H is a k-core of the network if and only if for every user in C: deg_H(i) ≤ k, and H
is the maximum sub-graph which fulfils this condition. With deg_H(i) we denote the degree of the node i
in the sub-graph H. A user has k-index equal k if it belongs to the k-core but not to the (k+1)-core.
In simple words, k-core decomposition starts with k = 1 and removes all nodes with degree equal to 1.
The procedure is repeated iteratively until no vertices with degree 1 remain. Next, all removed nodes
are assigned k-index to be 1. It continues with the same procedure for k = 2 and obtains vertices with
indexes equal 2, and so on. The process stops when the last node from the network is removed at the
k_max^th step. The variable k_max is then the maximum shell index of the graph.
References
Adamic, L. A., & Glance, N. (2005). The political blogosphere and the 2004 US election: divided they
blog. Proceedings of the 3rd international workshop on Link discovery (pp. 36-43). АСМ.
Aragón, P., Kappler, K. E., Kaltenbrunner, A., Laniado, D., & Volkovich, Y. (2013). Communication
dynamics in twitter during political campaigns: The case of the 2011 Spanish national election.
Policy & Internet, 5(2), 183--206.
Bennett, W. L., & Segerberg, A. (2012). The logic of connective action: Digital media and the
personalization of contentious politics. Information, Communication & Society, 15(5), 739-768.
Blondel, V. D., Guillaume, J.-L., Lambiotte, R., & Lefebvre, E. (2008). Fast unfolding of communities in
large networks. Journal of Statistical Mechanics: Theory and Experiment, 2008(10), P10008.
Borge, R., & Santamarina, E. (2015). From protest to political parties: online deliberation in the new
parties in arising in Spain. Democracy: A Citizen Perspective. Turku.
Borondo, J., Morales, A., Losada, J. C., & Benito, R. M. (2012). Characterizing and modeling an electoral
campaign in the context of Twitter: 2011 Spanish Presidential election as a case study. Chaos: an
interdisciplinary journal of nonlinear science, 22, 23-38.
Brin, S., & Page, L. (2012). Reprint of: The anatomy of a large-scale hypertextual web search engine.
Computer networks, 56(18), 3825-3833.
Castells, M. (2013). Networks of outrage and hope: Social movements in the Internet age. John Wiley & Sons.
Congosto, M. L., Fernández, M., & Moro Egido, E. (2011). Twitter y política: Información, opinión y
¿Predicción? Cuadernos de Comunicación Evoca, 4, 11-15.
Conover, M., Ratkiewicz, J., Francisco, M., Gonçalves, B., Menczer, F., & Flammini, A. (2011). Political
Polarization on Twitter. ICWSM.
Feller, A., Kuhnert, M., Sprenger, T. O., & Welpe, I. M. (2011). Divided They Tweet: The Network
Structure of Political Microbloggers and Discussion Topics. ICWSM. Barcelona.
Freeman, L. C. (1979). Centrality in social networks conceptual clarification. Social networks, 1(3), 215-
239.
Garcia, D., Abisheva, A., Schweighofer, S., Serdult, U., & Schweitzer, F. (2015). Ideological and Temporal
Components of Network Polarization in Online Political Participatory Media. Policy & Internet,
7(1), 46-79.
Gerbaudo, P. (2012). Tweets and the streets: Social media and contemporary activism. Pluto Press.
Gini, C. (1912). Variabilità e mutabilità. (S. T. Pizetti E, Ed.) Reprinted in Memorie di metodologica statistica,
1.
González-Bailón, S., Borge-Holthoefer, J., Rivero, A., & Moreno, Y. (2011). The dynamics of protest
recruitment through an online network. Scientific reports, 1.
Granovetter, M. S. (1973). The strength of weak ties. American journal of sociology, 1360-1380.
Gruzd, A., & Roy, J. (2014). Investigating political polarization on Twitter: A Canadian perspective. Policy
& Internet, 6(1), 28-45.
Jacomy, M. (2011). Force atlas 2 layout.
Katz, R. S., & Mair, P. (1995). Changing models of party organization and party democracy the
emergence of the cartel party. Party politics, 1(1), 5-28.
Lipset, S. M., Trow, M. A., Coleman, J. S., & Kerr, C. (1956). Union democracy: The internal politics of the
International Typographical Union. Free Press Glencoe.
Margetts, H. (2001). The cyber party. ECPR Joint Sessions. London. Retrieved from http://www.
governmentontheweb.org/sites/governmentontheweb.org/files/Cyber_party_paper.pdf
Michels, R. (1915). Political parties: A sociological study of the oligarchical tendencies of modern democracy.
Hearst's International Library Company.
Mills, C. W. (1999). The power elite. Oxford University Press.
Monterde, A., Blanche, D., Calleja-López, A., & Fernández-Ardèvol, M. (2015). The 15M movement in its
third anniversary: a survey. IN3 Working Paper Series.
Monterde, A., Toret, J., Serrano, E., & Calleja-López, A., (2015). De las redes y las plazas al espacio
institucional: Movimiento-red 15M e iniciativas electorales emergentes. Empiria: revista de
metodología de ciencias sociales. UNED.
Mosca, G., Livingston, A., & Kahn, H. D. (1939). The Ruling Class: Elementi Di Scienza Politica. Ed. and Rev.
with an Introd. by A. Livingston. McGraw-Hill.
Newman, M. E. (2004). Analysis of weighted networks. Physical Review E, 70(5), 56-131.
Pareto, V. (1935). The mind and society. Рипол Классик.
Peña-López, I., Congosto, M., & Aragón, P., (2014). Spanish Indignados and the evolution of 15M: towards
networked para-institutions. Journal of Spanish Cultural Studies, 15(1-2), 189–216.
Sandiumenge, L. (2015, 5 23). La guerrilla digital de Colau. Districte 15. Retrieved from
http://districte15.info/la-guerrilla-digital-de-colau/
Sunstein, C. R. (2009). Republic.com 2.0. Princeton University Press.
Toret. (2015). Una mirada tecnopolítica al primer año de Podemos. Seis hipótesis. Teknokultura, 12(1),
121-135.
Toret, J., Calleja-López, A., Marín, Ó., Aragón, P., Aguilera, M., Barandiaran, X., & Monterde, A. (2015).
Tecnopolítica y 15M: La potencia de las multitudes conectadas. Barcelona: Editorial UOC.
Varela Ferrio, J. (2015). La brecha digital en España: estudio sobre la desigualdad postergada. Comisión
Ejecutiva Confederal UGT. Secretaría de Participación Sindical e Institucional: Madrid. Retrieved from
http://www.ugt.es/Publicaciones/BRECHADIGITAL_WEB.pdf
Watts, D. J., & Strogatz, S. H. (1998). Collective dynamics of 'small-world'networks. Nature, 393(6684),
440-442.

